

Section: Module 5: Lesson 3: The Log Scales | Intro to Algebra & Trigonometry | NextGenU.org
-
Student Learning Outcomes:
Upon completion of this lesson, you will be able to:- Explain what a semi-log plot is, and how it is used.
- Explain the difference between arithmetic and logarithmic line charts.
Click here to start this lesson-
Students mustMark as done
Required Learning Resources and Activities
-
Students mustView
What's a Semi log plot and how can you use it for Covid-19 data? (10 minutes)
Wired for Science Magazine- 2020
-
Students mustView
Read the entire article. (10 minutes)
Pennsylvania Department of Health - Tools of the Trade- 2022
-
Students mustViewStart discussions: 1
In this activity, you will solve a case problem about the height and circumference of a given material. Then, you will plot the graph and the log-log values.
Step 1. Review
Review this background information before studying the case problem for this activity:
Background
Do the physical functions of biological organisms change as the size of the organism changes? For example, does the flight speed of a bird increase as the length of its wings increase? Does the metabolic rate of a mammal increase as the mammal gets larger? Does the height of a California redwood tree increase as the circumference of its trunk increases?
There are several mathematical equations used to model the relationship between these variables. One possible equation is
y= mx\( \frac{3}{4} \)
This type of function (equation) is called a power function.
Another possible function that models such relationships is the exponential function.
If the model is a power function, which is not linear, it can be transformed into a logarithm function, which will form into a straight line, as the following shows.
We take the power function
 and take the log of both sides. We will have
log y= log (axm)= log a + logxm = log a + m log x
Now, we know that the general form of the equation for a line is Y = mX + a.
If we let Y= log y, A=log a, X= log x
Then log y= m log x + log a becomes Y = mX + a, which is a straight line. So, a power function will plot as a straight line on a log-log graph.
Step 2. Analyze
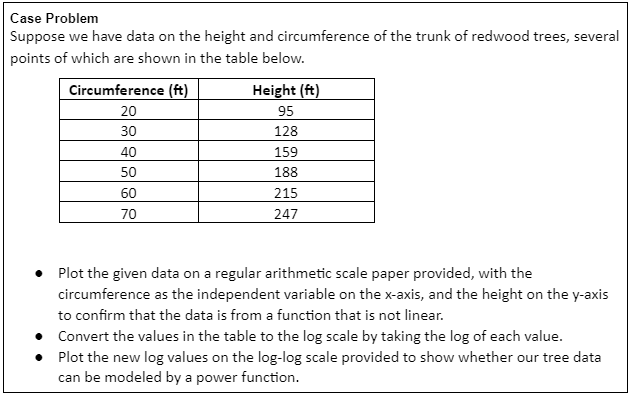
Analyze the case problem below.
Step 3. Respond
Respond to the case problem by fulfilling all the required output for this activity. Plot the required data using the systems below:
Log-log scale paper
Step 4. Share
To share your work, click on the “Add a new discussion topic” button under this post and paste your work in the “Message” box. Make sure to reference others’ intellectual property when necessary. All references should follow 7th Edition APA formatting. For further instructions, see the resource on the Himmelfarb Health Sciences Library: APA citation resource (N.B. references are excluded from word counts).
Step 5: Interact
To complete the activity, you will need to reply to at least two posts made by your peers in a respectful and professional manner. Ensure that your post engages your peers' ideas by including a reflection on their comments, sharing ideas of other potential difficulties and parties involved, or asking thought-provoking questions. If peer comments on your posting, please reply. To post a reply, click “Reply” on a particular discussion, write your feedback and then click on “post to the forum.”
OPTIONAL Step 6: Interact (10 minutes)
If you would like to, you can reply to your peers' posts in a respectful and professional manner. Ensure that your post engages your peers' ideas by including a reflection on their comments, sharing ideas of other potential difficulties and parties involved, or asking thought-provoking questions. If a peer comments on your posting, please reply. To post a reply, click “Reply” on a particular discussion, write your feedback and then click on “Post to forum.”
-
Quiz: Module 5: Lessons 2 - 3
To access the quiz, click on the name of the quiz provided above. On the following screen, click the "Preview quiz now" button to respond to the questions.
TO PASS THIS QUIZ YOU MUST OBTAIN A SCORE OF 80%.
-
Students mustViewReceive a gradeReceive a passing grade
To access the quiz, click on the name of the quiz provided above. On the following screen, click the "Preview quiz now" button to respond to the questions.
-
Students mustMark as done
Additional Resources for Optional Learning
-
-
Students mustView
Watch the video. (12 minutes)
Khan Academy-2022

