loader image
Skip to main content
  • Intro to SPSS
    0%

Focus Mode is ON. Click on the ‘collapse icon’ to close it.

  • Previous
  • Course data
    Introduction
    Course Registration
    Peer Corner
    Pre-Test
    Module 1: Lesson 1: What is SPSS?
    Introduction to SPSS
    Module 1: Lesson 2: The Six Windows of the SPSS Interface: The Data Editor, the Output Viewer, the Pivot Table Editor, the Chart Editor, the Text Output Editor, and the Syntax Editor
    The Six Windows of the SPSS Interface
    Module 1: Lesson 3: Navigating SPSS Sessions
    Starting and Ending an SPSS Session
    Module 1: Familiarity with SPSS
    Module 2: Lesson 1: Inputting and Importing Data
    Getting Up and Running with SPSS
    Loading Data and Defining Variables in SPSS
    Module 2: Lesson 2: Saving Your SPSS Data File
    Saving Data in SPSS - Overview
    Saving Data Files in SPSS: A Hands-On Tutorial
    Saving Your Data in SPSS
    Module 2: Lesson 3: Cleaning a Dataset in SPSS
    Learning Resource
    Module 3: Lesson 1: Descriptive Statistics
    Descriptive Statistics with SPSS
    Module 3: Lesson 2: Generating Graphs of Univariate Data
    Graphing of Univariate Data Using SPSS Part 1
    Graphing of Univariate Data Using SPSS Part 2
    Module 3: Lesson 3: Generate a Frequency Table and Its Accompanying Graphs
    Creating a Frequency Table, Frequency Histogram, and the Ogive with SPSS
    Module 3: Lesson 4: Generating Graphs of Bivariate Data
    Bivariate Graphing with SPSS
    Final Exam
    Course and Self Evaluation & Certificate
    Course Activities
    Activities.
  • Next
  • Categories
    • All categories
    • Public Health
    • Medicine Courses
    • Nursing
    • Professional Development Courses
    • Community Health Workers
    • Humanitarian Response
    • Health Sciences
    • Sciences
    • For our institutional partners: Full Programs/Graduate Medical Education
    • NIED Courses
  • Home
  • Calendar
  • About Us
    About Us FAQs The Frank Foundation Board Members Publications Quality Assurance
  • Guests
    Learners Mentors Universities
  • Courses
    All Courses Medicine Courses Public Health Courses Community Health Courses Professional Development Courses Nursing Courses Health Sciences Sciences
  • Programs
    Addiction Training for Health Professionals Public Health U - MPH Primary Education STEPS Humanitarian U
  • Connect
    Contact Us Volunteer Careers Join Our Network sign up for our newsletter
  • Donate
  • Blog
  • Recent
    Environmental Health SC
    Climate Change and Health - old
You are currently using guest access
Log in
Categories Collapse Expand
  • All categories
  • Public Health
  • Medicine Courses
  • Nursing
  • Professional Development Courses
  • Community Health Workers
  • Humanitarian Response
  • Health Sciences
  • Sciences
  • For our institutional partners: Full Programs/Graduate Medical Education
  • NIED Courses
Home Calendar About Us Collapse Expand
About Us FAQs The Frank Foundation Board Members Publications Quality Assurance
Guests Collapse Expand
Learners Mentors Universities
Courses Collapse Expand
All Courses Medicine Courses Public Health Courses Community Health Courses Professional Development Courses Nursing Courses Health Sciences Sciences
Programs Collapse Expand
Addiction Training for Health Professionals Public Health U - MPH Primary Education STEPS Humanitarian U
Connect Collapse Expand
Contact Us Volunteer Careers Join Our Network sign up for our newsletter
Donate Blog Recent Collapse Expand
Environmental Health SC
Climate Change and Health - old
Intro to SPSS
Expand all Collapse all
Skip Course Activities and Resources

Course Activities and Resources

  • Syllabus
  • Resources
  • Learning Activites
  • Quizzes

      Professional Development Courses

      Intro to SPSS

      • Course
      • Competencies
      • Professional Development Courses

        Intro to SPSS

        0% complete
        0% complete
        Resume

        Introduction

        • questionnaire icon
          Course Registration Questionnaire
          Students must
          Student must submit this questionnaire to complete it
        • forum icon
          Peer Corner Forum
        • quiz icon
          Pre-Test Quiz
          Students must
          View
          Receive a grade
        Show More
      • How to create an account and enroll in the course?


      • Homepage


        Welcome to "SPSS 1," a course structured to help you navigate through the complexities of one of the world's most popular statistical software packages. SPSS, or Statistical Package for the Social Sciences, is a dynamic tool embraced by researchers, analysts, and students to manage, analyze, and visualize data in a comprehensive and meaningful manner. Its user-friendly interface and wide-ranging features make SPSS an invaluable resource in diverse fields, ranging from social sciences and healthcare research to market research and business analytics.

        This course begins with an introduction to SPSS, highlighting its key functionalities. Participants learn to maneuver through the SPSS interface, import and input data, and define variable properties. The course then transitions into data cleaning and preparation, ensuring data priming for analysis. There's a deep dive into finding summary numbers and creating graphical visualizations for both univariate and bivariate data. Interactive activities and practical exercises are woven into the course, providing valuable hands-on experience and facilitating the application of newly acquired knowledge in real-time.

        By the conclusion of "SPSS 1," a solid foundation in SPSS will be established, alongside the capability to conduct preliminary data analysis with confidence. Whether new to statistical software or an experienced analyst seeking to refresh SPSS skills, this course promises a robust start.

        There are three (3) modules to complete, which include:

        • Module 1: Understanding the SPSS Interface
        • Module 2: Data Import and Management
        • Module 3: Descriptive Statistics, Charts, and Graphs with SPSS

        This course was developed by Dr. Marco Aurelio Hernandez (Ph.D., MSc (Stat and Edu), BSc) and Alixandria Ali (BSc).


        Engaging with this course

        • To register for this course, complete the registration form. Begin the course with Module 1. For each lesson, read the description. 
        • You can click on the collection of resources in each module. 
        • There is a forum in each Module for activity submission and peer evaluation, and you can add a new topic or respond to a previous one. You can share your learning from this and other readings, comment on the topics from your own experience, comment on others' posts, or provide feedback on how we can improve the content and/or presentation.
        • There is a final quiz to assess your understanding of some important concepts. Click on the hyperlinks to take you to these items in each topic.

        Requirements to obtain the certificate 

        You may browse this course for free to learn for your personal enrichment. There are no requirements.

        To PASS and obtain a certificate, a learner must successfully complete:

        • All reading requirements
        • All activity discussion forums
        • The final exam with a minimum of 80% and a maximum of 3 attempts 
        • The self and course evaluation forms

        Subscribe to our newsletter to be notified of future updates and new courses and to be part of our community.

      • Module 1: Understanding the SPSS Interface

        Competency covered in this module:

        • Understand the features and functions of SPSS.
      • Module 1: Lesson 1: What is SPSS?

        Student Learning Outcomes:
        Upon completion of this lesson, you will be able to:
        • Explain what SPSS is and what it is used for.
        Approximate time required for the readings for this lesson (at 144 words/minute): 2 minutes.

        Click here to start this lesson

        • Required Learning Resources and Activities
        • resource icon
          Introduction to SPSS File
          Students must
          Mark as done

          Read the entire article (2 mins)

          36.7 KB
      • Module 1: Lesson 2: The Six Windows of the SPSS Interface: The Data Editor, the Output Viewer, the Pivot Table Editor, the Chart Editor, the Text Output Editor, and the Syntax Editor

        Student Learning Outcomes:
        Upon completion of this lesson, you will be able to:
        • Navigate and explain the functions of the six interface windows of SPSS.
        Approximate time required for the readings for this lesson (at 144 words/minute): 8 minutes.

        Click here to start this lesson

        • Required Learning Resources and Activities
        • resource icon
          The Six Windows of the SPSS Interface File
          Students must
          Mark as done

          Read the entire article. (8 minutes)

          2.3 MB
      • Module 1: Lesson 3: Navigating SPSS Sessions

        Student Learning Outcomes:
        Upon completion of this lesson, you will be able to:
        • Start and end an SPSS session and know when and how to get help while using the application.
        Approximate time required for the readings for this lesson (at 144 words/minute): 58 minutes.

        Click here to start this lesson

        • Students must
          Mark as done
          Required Learning Resources and Activities
        • resource icon
          Starting and Ending an SPSS Session File
          Students must
          Mark as done

          Read the entire article. (2 minutes)

          90.8 KB
        • forum icon
          Module 1: Familiarity with SPSS Forum
          Students must
          View

          Objective:

          In this activity, you will apply the knowledge and skills acquired in Module 1. This involves explaining the purpose of SPSS, efficiently navigating its interface, and initiating and terminating an SPSS session.


          Instructions:

          • Launch the SPSS software on your computer.
          • Describe what each of the six windows in the SPSS interface is used for. Use screenshots to illustrate your points.
          • Import a simple dataset (you may create a small one if needed). Explain how each window of the SPSS interface contributes to the process of data importation, analysis, and output generation.
          • Data Editor Window.
          • Output Viewer.
          • Pivot Table Editor.
          • Chart Editor.
          • Text Output Editor.
          • Syntax Editor.
          • Conduct a simple descriptive analysis (like mean or frequency) on one of your variables and generate an output.
          • Modify the output using the Pivot Table Editor and Chart Editor. Explain the changes you made and why.
          • Save your work in SPSS by creating a new dataset.
          • Close the dataset, and then exit SPSS. Explain the steps you took to accomplish this.
          • Finally, explore the Help Topics in SPSS. Find information on how to calculate the median in SPSS and provide a brief explanation.

          Deliverable:

          For this activity, submit a document that:

          • Explains what SPSS is and what it is used for.
          • Provides a walkthrough of your process, with screenshots and accompanying explanations.
          • Includes a brief summary of how to calculate the median in SPSS based on the Help Topics information.
          • Remember, this activity is designed to demonstrate your understanding of SPSS's key features and functionality.

          By completing this activity, you will meet the following learning outcomes:

          • Explain what SPSS is and what it is used for.
          • Navigate and explain the functions of the six interface windows of SPSS.
          • Start and end an SPSS session, and know when and how to get help while using the application.

          Note: Be aware of privacy and confidentiality obligations when using and sharing data. Ensure the data you use for this exercise is either fabricated or anonymized to eliminate any identifying details.

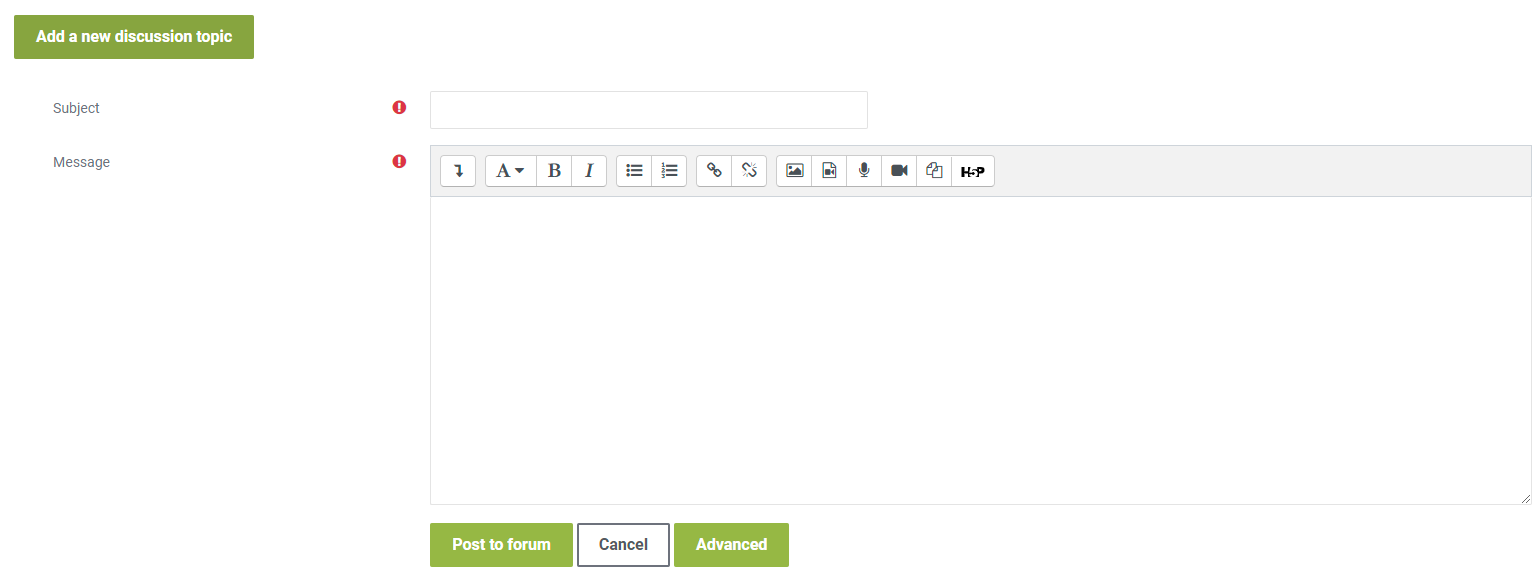
          To share your work, click on the “Add a new discussion topic” button at the bottom of this post, then click on the “Advanced” button as shown in the picture below. 


          Drag and drop your completed template inside the “Attachment” as shown in the picture below and click on “Post” after you have uploaded your completed template.

          To complete this activity, you will need to reply to at least one post made by your peers respectfully and professionally. Be sure that your post engages your peers' ideas by providing feedback on their comments, sharing ideas of other potential problems/solutions, or asking thought-provoking questions. If a peer comments on your posting, please reply. To post a reply, click “Reply” on a particular discussion list below, write your feedback, and then click on “Post to forum.”

        • quiz icon
          Quiz: Module 1

          To access the quiz, click on the name of the quiz provided above. On the following screen, click the "Preview quiz now" button to respond to the questions.

          TO PASS THIS QUIZ, YOU MUST OBTAIN A SCORE OF 80% 

          Not available unless: The activity Module 1: Familiarity with SPSS is marked complete
      • Module 2: Data Import and Management

        Competency covered in this module: 
        • Import and manage different types of data in SPSS.
      • Module 2: Lesson 1: Inputting and Importing Data

        Student Learning Outcomes:
        Upon completion of this lesson, you will be able to:
        • Input data into SPSS by importing from outside sources or using an existing data file.
        Approximate time required for the readings for this lesson (at 144 words/minute): 38 minutes.

        Click here to start this lesson

        • Required Learning Resources and Activities
        • resource icon
          Getting Up and Running with SPSS File
          Students must
          Mark as done

          Read the entire article. (23 minutes)

          7.2 MB
        • resource icon
          Loading Data and Defining Variables in SPSS File
          Students must
          Mark as done

          Watch the entire presentation. (15 minutes)

          2.1 MB
      • Module 2: Lesson 2: Saving Your SPSS Data File

        Student Learning Outcomes:
        Upon completion of this lesson, you will be able to:
        • Save either new or pre-existing data files in SPSS.
        Approximate time required for the readings for this lesson (at 144 words/minute): 28 minutes.

        Click here to start this lesson

        • Students must
          Mark as done
          Required Learning Resources and Activities
        • resource icon
          Saving Data in SPSS - Overview File
          Students must
          Mark as done

          Read the entire article. (2 minutes)

          57.9 KB
        • resource icon
          Saving Data Files in SPSS: A Hands-On Tutorial
          Students must
          Mark as done

          Read the entire article. (15 minutes)

          2.1 MB
        • resource icon
          Saving Your Data in SPSS File
          Students must
          Mark as done

          Watch the entire presentation. (8 minutes)

          845.7 KB
      • Module 2: Lesson 3: Cleaning a Dataset in SPSS

        Student Learning Outcomes:
        Upon completion of this lesson, you will be able to:
        • Clean and prepare a dataset for analysis.
        Approximate time required for the readings for this lesson (at 144 words/minute): 1 hour and 5 minutes.

        Click here to start this lesson

        • Students must
          Mark as done
          Required Learning Resources and Activities
        • resource icon
          Learning Resource File
          Students must
          Mark as done

          Watch the entire presentation. (15 minutes)

          1.2 MB
        • forum icon
          Module 2: Practical Exercise on SPSS Forum

          Objective:

          Apply your learning from Module 2 to a practical SPSS task. You will demonstrate your understanding of importing and inputting data, defining variable properties, cleaning data, and saving your work within SPSS.

          Instructions:

          • Launch the SPSS software on your computer.
          • Import an Excel data set (you may use one of your own or create one for this task).
          • Familiarize yourself with the default variable names and properties assigned by SPSS.
          • Use the Variable View tab and apply the appropriate guidelines to rename your variables.
          • Reflect on the properties of each variable and make adjustments where necessary. These properties include type, width, decimal places, labels, values, and measure.
          • Review your data in the Data View tab. Are there any necessary adjustments that need to be made to ensure your dataset is clean and ready for analysis?
          • Save your work by going to File > Save As. Make sure it is saved as a .sav file (the usual format for datasets in SPSS).
          • Test your saved file by attempting to open it from the File > Open > Data pathway.

          Deliverable:

          For this activity, you will submit screenshots of your process, accompanied by a brief explanation of each step. This documentation can be in the form of a Word document or a PDF.


          This activity will help you practically apply the following learning outcomes:

          • Inputting data into SPSS by importing from outside sources or using an existing data file.
          • Saving new or pre-existing data files in SPSS.
          • Cleaning and preparing a dataset for analysis
          Note: Be mindful of the privacy and confidentiality of your data. Do not use real data that could compromise the privacy of individuals or organizations.

          To share your work, click on the “Add a new discussion topic” button at the bottom of this post, then click on the “Advanced” button as shown in the picture below. 


          Drag and drop your completed template inside the “Attachment” as shown in the picture below and click on “Post” after you have uploaded your completed template.


          To complete this activity, you will need to reply to at least one post made by your peers  respectfully and professionally. Be sure that your post engages your peers' ideas by providing feedback on their comments, sharing ideas of other potential problems/solutions, or asking thought-provoking questions. If a peer comments on your posting, please reply. To post a reply, click “Reply” on a particular discussion list below, write your feedback and then click on “Post to forum.”

          Not available unless: The activity Quiz: Module 1 is complete and passed
        • quiz icon
          Quiz: Module 2

          To access the quiz, click on the name of the quiz provided above. On the following screen, click the attempt quiz button to view the case studies and respond to the questions.

          TO PASS THIS QUIZ, YOU MUST OBTAI A SCORE OF 80%

          Not available unless: The activity Module 2: Practical Exercise on SPSS is marked complete
      • Module 3: Descriptive Statistics, Charts, and Graphs with SPSS

        Competency covered in this module: 
        • Find descriptive statistics to summarize a dataset.
        • Explore data relationships using charts and graphs.
      • Module 3: Lesson 1: Descriptive Statistics

        Student Learning Outcomes:
        Upon completion of this lesson, you will be able to:
        • Find the summary numbers of a dataset using SPSS.
        Approximate time required for the readings for this lesson (at 144 words/minute): 20 minutes.

        Click here to start this lesson
        • Required Learning Resources and Activities
        • url icon
          Descriptive Statistics with SPSS URL
          Students must
          View

          Watch the entire video. (20 minutes)

      • Module 3: Lesson 2: Generating Graphs of Univariate Data

        Student Learning Outcomes:
        Upon completion of this lesson, you will be able to:
        • Create and interpret graphs for univariate data (dot plots, stem-and-leaf plots, pie charts, and box plots) using SPSS.
        Approximate time required for the readings for this lesson (at 144 words/minute): 44 minutes.

        Click here to start this lesson
        • Students must
          Mark as done
          Required Learning Resources and Activities
        • url icon
          Graphing of Univariate Data Using SPSS Part 1 URL
          Students must
          View

          Watch the entire video. (25 minutes)

        • url icon
          Graphing of Univariate Data Using SPSS Part 2 URL
          Students must
          View

          Watch the entire video. (19 minutes)

      • Module 3: Lesson 3: Generate a Frequency Table and Its Accompanying Graphs

        Student Learning Outcomes:
        Upon completion of this lesson, you will be able to:
        • Create a frequency table, a frequency histogram, and an ogive from a univariate dataset using SPSS.
        Approximate time required for the readings for this lesson (at 144 words/minute): 21 minutes.

        Click here to start this lesson
        • Students must
          Mark as done
          Required Learning Resources and Activities
        • url icon
          Creating a Frequency Table, Frequency Histogram, and the Ogive with SPSS URL
          Students must
          View

          Watch the entire video. (21 minutes)

      • Module 3: Lesson 4: Generating Graphs of Bivariate Data

        Student Learning Outcomes:
        Upon completion of this lesson, you will be able to:
        • Create and interpret graphs for bivariate data using SPSS.
        Approximate time required for the readings for this lesson (at 144 words/minute): 1 hour and 26 minutes.

        Click here to start this lesson
        • Required Learning Resources and Activities
        • url icon
          Bivariate Graphing with SPSS URL
          Students must
          View

          Watch the entire video. (36 minutes)

        • forum icon
          Module 3: Analyzing and Visualizing Data with SPSS Forum

          Objective:

          The objective of this activity is to apply the skills and knowledge you have obtained in Module 3. You will be working with SPSS to find summary numbers, create graphs for univariate and bivariate data, and produce frequency tables and histograms.

          Instructions:

          • Launch SPSS and import a dataset or create a new one.
          • Identify a variable in your dataset that you will use to find summary numbers.
          • Using the “Analyze > Descriptive Statistics” menu, find the summary numbers for your identified variable.
          • Identify a nominal variable in your dataset and create a pie chart to visualize the distribution. Similarly, create a box plot for this variable.
          • For a continuous variable in your dataset, create a frequency table, histogram, and an ogive to visualize the distribution.
          • Identify two variables for bivariate analysis in your dataset. Create a scatterplot to visualize the relationship between these two variables.
          • Analyze and interpret the graphs you have created.

          Deliverable:

          For this activity, submit a document that:

          • Provides screenshots of the process and final output of each step and explains your actions.
          • Includes an interpretation of the data visualizations and summary numbers you have obtained. 

          This comprehensive activity will help you achieve the following learning outcomes:

          • Find the summary numbers of a dataset using SPSS.
          • Create and interpret graphs for univariate data (dot plots, stem-and-leaf plots, pie charts, and box plots) using SPSS.
          • Create a frequency table, a frequency histogram, and an ogive from a univariate dataset using SPSS.
          • Create and interpret graphs for bivariate data using SPSS.

          Note: Be mindful of privacy and confidentiality obligations when using and sharing data. Ensure the data you use for this exercise is either made up or anonymized to prevent any violations of these obligations.

          To share your work, click on the “Add a new discussion topic” button at the bottom of this post, then click on the “Advanced” button as shown in the picture below. 


          Drag and drop your completed template inside the “Attachment” as shown in the picture below and click on “Post” after you have uploaded your completed template.


          To complete this activity, you will need to reply to at least one post made by your peers  respectfully and professionally. Be sure that your post engages your peers' ideas by providing feedback on their comments, sharing ideas of other potential problems/solutions, or asking thought-provoking questions. If a peer comments on your posting, please reply. To post a reply, click “Reply” on a particular discussion list below, write your feedback and then click on “Post to forum.”


          Not available unless: The activity Quiz: Module 2 is complete and passed
        • quiz icon
          Quiz: Module 3

          To access the quiz, click on the name of the quiz provided above. On the following screen, click the attempt quiz button to view the case studies and respond to the questions.

          TO PASS THIS QUIZ, YOU MUST OBTAIN A SCORE OF 80% 

          Not available unless: The activity Module 3: Analyzing and Visualizing Data with SPSS is marked ... ...
          Not available unless: The activity Module 3: Analyzing and Visualizing Data with SPSS is marked complete
      • Final Exam

        Click here to start Final Examination

        • quiz icon
          Final Exam Quiz

          To take the final exam, you must complete all quizzes and complete all the required activities. The final exam consists of 21 questions, and you will have 21 minutes to complete it. When the time is over, you will have two minutes to submit your attempt before it expires, and your progress is discarded. You will not be able to answer additional questions in the grace period.

          To access the exam, click on the name of the exam provided above. On the following screen, click the attempt quiz button to respond to the questions.


          Not available unless: All of: ...
          Not available unless:
          • All of:
            • The activity Course Registration is marked complete
            • The activity Pre-Test is marked complete
            • The activity Quiz: Module 1 is marked complete
            • The activity Quiz: Module 2 is marked complete
            • The activity Quiz: Module 3 is marked complete
          • All of:
            • The activity Module 1: Familiarity with SPSS is marked complete
            • The activity Module 2: Practical Exercise on SPSS is marked complete
            • The activity Module 3: Analyzing and Visualizing Data with SPSS is marked complete
      • Course and Self Evaluation & Certificate

        In this section, you can provide feedback about this course to help us make NextGenU.org better. Once evaluations are completed, you will be able to download your certificate of completion.

        Click here give your feedback

        • questionnaire icon
          Course Evaluation Questionnaire
          Not available unless: The activity Final Exam is marked complete
        • questionnaire icon
          Self Evaluation Questionnaire
          Not available unless: The activity Final Exam is marked complete
      • Course Activities

        • page icon
          Activities. Page
          Students must
          Mark as done
      Skip Rating and Review

      Rating and Review

      0

      0 Course Rating

      0%
      0%
      0%
      0%
      0%

      Reviews

      Contact site support
      You are currently using guest access (Log in)
      Powered by Moodle


      Copyright © 2025 NextGenU.org / All Rights Reserved


      Privacy Policy 


      Terms Of Use 


      Privacy Policy Terms & Conditions

      Copyrights Content