

Biostatistics
-
-
Students mustStudent must submit this questionnaire to complete it
-
Students mustViewReceive a grade
Show More-


This introductory course in Biostatistics provides foundational skills and knowledge in biostatistics and students will gain a deeper understanding of its relevance and application to public health, health policy, clinical medicine, and health economics. All parts of this training are free, including registration, learning, testing, and a certificate of completion. The course in Biostatistics is intended for students of public health, clinical medicine, biology, and other health sciences.
This course is co-sponsored by the University of the Incarnate Word, the Association for Prevention Teaching and Research (APTR), and the US Centers for Disease Control and Prevention (CDC). Like all NextGenU.org courses, it is competency-based, using competencies from the Association of Schools and Programs of Public Health (ASPPH). This course uses learning resources from world-class academic and governmental organizations such as Penn State University, Rice University, and the US Centers for Disease Control and Prevention (CDC).

For a publication on this course’s efficacy, see “Building Public Health Capacity through Online Global Learning,” (2018), Open Praxis, to see more research related to NextGenU.org’s educational model, check out NextGenU.org’s publication page. Subscribe to our newsletter to be notified of future updates, new courses, and to be part of our community.
There are two components to this course. The first component involves completing the modules and which provide:
- An introduction to probability and sampling distributions;
- An overview of confidence intervals, hypothesis testing, regression analysis, confounding, and interactions;
- Skills for the application of biostatistics in the practice and study of public health.
In order to receive a certificate of completion, you will need to also complete the second, skills-based component of the course, which requires you to identify a mentor with professional health care training at least at the bachelor’s level, and with a certificate or other specific training in Public Health, who can provide you with feedback on the assignments you submit.
The results of your assessments will be provided to you, and we can report your testing information and share your work with anyone you request (school, employer, etc.). The evaluation you provide at the course’s conclusion will help us improve the training for future students. We hope you find this Biostatistics course a wonderful learning experience!
Approximate time for the required readings in this course is 49 hours at an average reading rate of 144 words/minute; in addition, there are required activities as described above.
Before you begin the course, please take a moment to take the short knowledge Pre-course test below. It allows us to assess various aspects of the course itself and is mandatory to receive your certificate upon completion of the course. Then you may start Module 1: The Basics of Biostatistics.
The course requires completion of peer and mentored activities. At the end of each lesson, there is a practice quiz. At the end of the course, after you’ve completed each lesson, quiz, and activity, you’ll have access to a final exam, and a chance to assess the training. Once you’ve passed that last test, you will be able to download a certificate of completion from NextGenU.org and our course’s co-sponsoring organizations (listed above). We keep all of your personal information confidential, never sell any of your information, and only use anonymized data for research purposes, and we are also happy to report your testing information and share your work with anyone (your school, employer, etc.) at your request. We hope that you will find this a rewarding learning experience, and we count on your assessment and feedback to help us improve this training for future students.
Before you begin the course, please take a moment to take the short knowledge Pre-test below. It allows us to assess various aspects of the course itself and is required to receive your certificate upon completion of the course.
Engaging with this Course:
You may browse this course for free to learn for your personal enrichment; there are no requirements.
To obtain a certificate
- Show in the registration fields that you have the appropriate prerequisites to be certified [a high school degree for college courses, a college degree for the master’s level courses, and enrollment in or graduation from a medical doctoral program for our medical doctoral-level courses].
- Take the brief pre-test.
- Complete all the reading requirements.
- Complete all quizzes.
- Complete all 6 peer activity and associated certification quizzes.
- Find a mentor and complete the 3 required mentor activities.
- Successfully complete the final exam with a minimum of 70% and a maximum of 3 attempts.
- Complete the self and course evaluation forms.
To obtain credit
- Complete all requirements listed above for the certificate.
- Your learning institution or workplace should approve the partner-university-sponsored NextGenU.org course for educational credit, as they would for their learner taking a course anywhere.
- NextGenU.org is happy to provide your institution with:
- a link to and description of the course training, so they can see all its components, including the cosponsoring universities and other professional organization cosponsors;
- your grade on the final exam;
- your work products (e.g. peer and mentored activities), and any other required or optional shared materials that you produce and authorize to share with them;
- your evaluations -- course, self, and peer assessments;
- a copy of your certificate of completion, with the co-sponsoring universities and other organizations listed.
We hope that you will find this a rewarding learning experience, and we count on your assessment and feedback to help us improve this training for future students.
Next Steps
- Take the short knowledge pre-test below. It allows us to assess various aspects of the course itself.
- Complete the registration form.
- Begin the course with Module 1: The Basics of Biostatistics. In each lesson, read the description, complete all required readings and any required activity, and take the corresponding quizzes.
-
Before starting this first module, please take a moment to take the short knowledge Pre-test above. It allows us to assess various aspects of the course itself and is mandatory to receive your certificate upon completion of the course.
Competencies covered in this module:

- Describe the roles biostatistics serves in the discipline of public health.
- Distinguish among the different measurement scales and the implications for selection of statistical methods to be used based on these distinctions.
- Apply descriptive techniques commonly used to summarize public health data.
- Apply descriptive and inferential methodologies according to the type of study design for answering a particular research question.
-
Data are everywhere around us. Making sense of the massive amounts of data for the purpose of improving the health of a population requires understanding statistical principles and developing skills in applying these concepts. In this first module, we start by looking at the different types of data we often encounter and what we can say about them in a basic sense using descriptive statistics. We will learn about different ways to present the data to highlight important messages and investigate designing studies to understand the practical applications of important statistical concepts. The type of data often determines what statistical tools we can use, so this module is crucial for upcoming materials in this course.
Resources in this module are quite diverse. The resources are not an exhaustive reference for tools for understanding and presenting descriptive statistics, but rather a starting point, covering the basic concepts.
Upon completion of this module, students should be able to:
- Explore the basic principles of statistics and some of its common uses
- Understand the basic principles of probability, descriptive statistics, and data analysis
- Understand how to generate descriptive statistics from data
- Understand the different types of variables, how they are used, and how to summarize the data
- Understand and identify the different types of plots and graphs
- Generate descriptive statistics from data, calculate descriptive statistics and standard deviations, and understand the methods of summarizing a single quantitative variable
- Summarize and describe the distribution of a categorical variable and understand the uses and implications of the normal distribution
- Understand the basic types of data, the main ways in which data are used, and important considerations when using data in analysis
- Identify the design of a study and explain how this impacts interpretation
- Apply knowledge and skills in working with different data types in a chosen public health setting
-
Learning Objectives
- Explore the basic principles of statistics and some of its common uses.
- Understand the basic principles of probability, descriptive statistics, and data analysis.
- Understand how to generate descriptive statistics from data.
-
Required Learning Resources and Activities
-
Students mustViewWatch the entire video.
-
Students mustView
- Read down from the slide titled "What is statistics?" (page 7 in the Adobe Toolbar).
- Understand the basic principles of probability, descriptive statistics, and data analysis.
-
Students mustView
- Read down to the beginning of the subsection titled "Parametric and Non-Parametric Tests".
- The rest of the article is considered supplemental reading. Ensure you click on the link to the erratum for the corrected version of Table 2.
- Understand the basic principles of probability, descriptive statistics, and data analysis.
-
Students mustViewExplore The University of North Carolina's web page and interact with Lesson 1 and 2. Begin by reviewing Lesson 1's measurement scale definitions to understand data types, then read Lesson 2 (Descriptive Statistics) in full, paying special attention to the three basic descriptive characteristics section, the "OK to Compute" table, and all three examples; other lessons are optional. (26 minutes)
-
Quiz: Module 1: Lesson 1
To access the quiz, click on the name of the quiz provided above. On the following screen, click the "Preview quiz now" button to view the case studies and respond to the questions.
Not available unless: The activity Pre-test is marked complete ...Not available unless:- The activity Pre-test is marked complete
- The activity Course Registration is marked complete
-
Learning Objectives
- Understand the different types of variables, how they are used, and how to summarize the data.
- Understand and identify the different types of plots and graphs.
-
Required Learning Resources and Activities
-
Students mustView
- Read the entire web page.
- Understand the different types of variables, how they are used, and how to summarize the data.
-
Students mustView
- Download the PDF version of the text by clicking on the appropriate link. Then, read sections 2.1, 2.2 (pertaining to histograms only), 2.3, and 2.4 (pages 68–100). If your understanding is weak, go through the exercises.
- Understand and identify the different types of plots and graphs.
-
Students mustView
- Read section 4.3, "Univariate graphical EDA" (pages 72–88), as well as subsection 4.5.2, "Scatterplot" (pages 95–97).
- Understand and identify the different types of plots and graphs.
-
Students mustView
- Read the entire chapter (pages 9–17).
- Understand the different types of variables, how they are used, and how to summarize the data.
-
Students mustViewReceive a gradeReceive a passing gradeTo access the quiz, click on the name of the quiz provided above. On the following screen, click the "Preview quiz now" button to view the case studies and respond to the questions.
-
Additional Learning Options
-
Read the entire article.
-
Learning Objectives
- Generate descriptive statistics from data, calculate descriptive statistics and standard deviations, and understand the methods of summarizing a single quantitative variable.
- Summarize and describe the distribution of a categorical variable, and understand the uses and implications of the normal distribution.
Click here to start this module-
Required Learning Resources and Activities
-
Students mustView
- Read section 4.2, "Univariate non-graphical EDA" (pages 63–72). Then, read part of section 4.4, "Multivariate non-graphical EDA" (from page 88 through page 90).
- Generate descriptive statistics from data, calculate descriptive statistics and standard deviations, and understand the methods of summarizing a single quantitative variable.
-
Students mustView
- Read the entire web page.
- Summarize and describe the distribution of a categorical variable and understand the uses and implications of the normal distribution.
-
Students mustView
- Click on the link “Lecture Handouts (pdf, ppt)" found on the left side of the web page. Then, under “Lecture Handouts”, click on the link “Chapter 4 Displaying, Summarizing Quantitative Data (pdf)” and read the entire handout.
- Summarize and describe the distribution of a categorical variable and understand the uses and implications of the normal distribution.
-
Students mustView
- Read down to the beginning of Example 4.5. Ignore any information relating to z-scores for now.
- Summarize and describe the distribution of a categorical variable and understand the uses and implications of the normal distribution.
-
Students mustViewReceive a gradeReceive a passing grade
To access the quiz, click on the name of the quiz provided above. On the following screen, click the "Preview quiz now" button to view the case studies and respond to the questions.
-
Additional Learning Options
-
- Download the PDF version of the text by clicking on the appropriate link. Then, read sections 2.5–2.7 (pages 100–120).
-
Learning Objectives
- Understand the basic types of data, the main ways in which data are used, and important considerations when using data in analysis.
- Identify the design of a study and explain how this impacts interpretation.
- Apply knowledge and skills in working with different data types in a chosen public health setting.
-
Required Learning Resources and Activities
-
Students mustView
- Read all slides.
- Understand the basic types of data, the main ways in which data are used, and important considerations when using data in analysis.
-
Students mustView
- Read the entire article. It provides an overview of the entire course.
- Understand the basic types of data, the main ways in which data are used, and important considerations when using data in analysis.
-
Students mustViewWatch the entire webinar. The webinar deals with how the timely analysis and public dissemination of data being used to guide and evaluate policy and public health response to the overdose crisis in Rhode Island. (60 minutes)
-
Students mustViewReceive a grade
- Find a local public health professional, someone who works regularly with health data and produces quantitative reports on health data -- e.g., mortality and morbidity, service and administrative data, health assessments, program evaluation.
- In 500 to 700 words, answer the questions below for yourself based on your research of your mentor’s role or organization.
- Data type

- What data does your mentor work with?
- Where do these data come from? How are they collected?
- What type of variables are they?
- Data quality and manipulations
- How does your mentor ensure the data are of good quality?
- Do they encounter missing data? What would they do about missing data?
- What other data quality or validity challenges do they experience?
- Measures and metrics
- What kind of statistics does your mentor produce in their reports?
- Why would they or their organization choose to report these measures rather than others?
- What kind of visual tools (e.g., tables and graphics) does your mentor use to present their data and findings? How are these data visualization tools appropriate to the audience?
- Apply knowledge and skills in working with different data types in a chosen public health setting.
-
Students mustViewMake a submission
- Discuss the following questions with your mentor to get their perspective. (Optional: Revise your peer-reviewed assignment to include what you learned from your mentor.)
- Data type

- What data does your mentor work with?
- Where do these data come from? How are they collected?
- What type of variables are they?
- Data quality and manipulations
- How does your mentor ensure the data are of good quality?
- Do they encounter missing data? What would they do about missing data?
- What other data quality or validity challenges do they experience?
- Measures and metrics
- What kind of statistics does your mentor produce in their reports?
- Why would they or their organization choose to report these measures rather than others?
- What kind of visual tools (e.g., tables and graphics) does your mentor use to present their data and findings? How are these data visualization tools appropriate to the audience?
- Apply knowledge and skills in working with different data types in a chosen public health setting.
-
Students mustViewReceive a gradeReceive a passing grade
To access the quiz, click on the name of the quiz provided above. On the following screen, click the "Preview quiz now" button to view the case studies and respond to the questions.
-
Additional Learning Options
-
-
Competencies covered in this module:

- Describe basic concepts of probability, random variation, and commonly used statistical probability distributions.
- Distinguish among the different measurement scales and the implications for selection of statistical methods to be used based on these distinctions.
- Apply descriptive techniques commonly used to summarize public health data.
- Apply common statistical methods for inference.
- Apply descriptive and inferential methodologies according to the type of study design for answering a particular research question.
-
Students mustMark as done
In this module, we cover three major topics of the foundation of biostatistics: 1) probability of events, 2) random variables, and 3) sampling distributions. Probability can be a simple concept, but it is sometimes not intuitive and may require much thinking and practice to fully grasp. Once we model health phenomena as random variables, then we can use the principles of probability to help us learn about their distributions and understand what is likely to happen. The central limit theorem and the normal model are very important tools to allow us to understand the big picture from a small snapshot (i.e., the relationship between population parameters and sample statistics) and to help us arrive at a concrete numerical measure of likelihood.
The resources in this module try to achieve a balance between theory and practice. These concepts may seem very different at first, but they are very much connected. Please feel free to explore different ways of presenting the concepts, and go back and forth between theory and practice until you are confident in your understanding and in calculating event probabilities.
Upon completion of this module, students should be able to:
- Relate the probability of an event to the likelihood of this event occurring
- Understand how to interpret and generate proportions from data
- Explain how relative frequency can be used to estimate the probability of an event
- Understand the concepts of probability, conditional probability, and independence
- Understand the concept of random variables
- Distinguish between samples and population and identify different types of samples
- Understand sampling distribution, variance, and the central limit theorem
- Understand the implications and uses of normality and skewness
- Be able to calculate and correctly interpret probability data from a sampling distribution
-
Learning Objectives
- Relate the probability of an event to the likelihood of this event occurring.
- Understand how to interpret and generate proportions from data.
- Explain how relative frequency can be used to estimate the probability of an event.
- Understand the concepts of probability, conditional probability, and independence.
-
Required Learning Resources and Activities
-
Students mustView
- Read the entire web page. Attempt any questions if understanding is weak.
- Relate the probability of an event to the likelihood of this event occurring.
-
Students mustView
- Download the PDF version of the text by clicking on the appropriate link. Then, read section 1.3, "Frequency, Frequency Tables, and Levels of Measurement" (pages 26–35).
- Understand how to interpret and generate proportions from data.
-
Students mustView
- Read the entire web page. Attempt any questions if understanding is weak.
- Explain how relative frequency can be used to estimate the probability of an event.
-
Students mustView
- Download the PDF version of the text by clicking on the appropriate link. Then, read sections 3.1 and 3.2, titled "Terminology" and "Independent and Mutually Exclusive Events", respectively (pages 176–188).
- Understand the concepts of probability, conditional probability, and independence.
-
Students mustViewReceive a gradeReceive a passing grade
To access the quiz, click on the name of the quiz provided above. On the following screen, click the "Preview quiz now" button to view the case studies and respond to the questions.
-
Additional Learning Options
-
- Read the entire article.
-
- Read the entire article.
-
Learning Objectives
- Understand the concept of random variables.
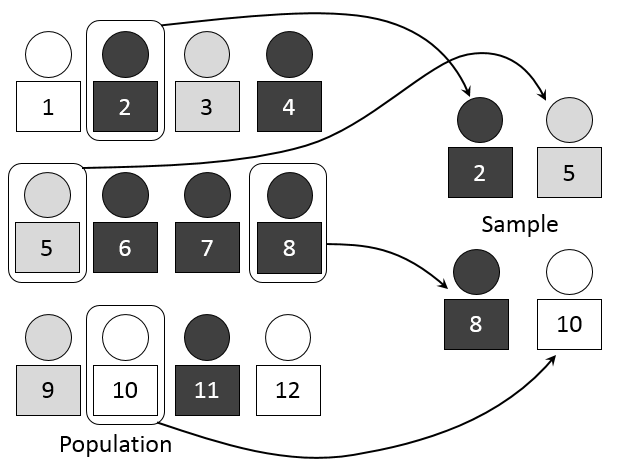
- Distinguish between samples and population and identify different types of samples.
- Understand sampling distribution, variance, and the central limit theorem.
- Understand the implications and uses of normality and skewness.
- Be able to calculate and correctly interpret probability data from a sampling distribution.
-
Required Learning Resources and Activities
-
-
Students mustView
- Read the entire web page.
- Understand the concept of random variables.
-
Students mustView
- Read the entire web page. Attempt any questions if understanding is weak.
- Distinguish between samples and population and identify different types of samples.
-
Students mustView
- Read the entire web page.
- Distinguish between samples and population and identify different types of samples.
-
Students mustView
- Read the entire chapter (pages 19–60). Focus on sections 3.1, 3.4, 3.5, 3.7, 3.8, and 3.9.
- Understand sampling distribution, variance, and the central limit theorem.
-
Students mustView
- Read the web page. Then, access the lesson "Sampling Distribution of the Mean" by clicking on the link titled "Standard" found on the left side of the web page under the heading "6. Sampling Distribution of the Mean" in the section titled "Chapter IX. Sampling Distribution". Read the content of that link.
- Understand sampling distribution, variance, and the central limit theorem.
-
Students mustView
- Read the entire web page.
- Understand sampling distribution, variance, and the central limit theorem.
-
Students mustView
- Read the entire article.
- Understand sampling distribution, variance, and the central limit theorem.
-
-
Students mustView
- Read the web page, as well as the next two web pages, "1.5.2 – Measures of Position" and "1.5.3 – Measures of Variability". Access lessons 1.5.2 and 1.5.3 by either clicking on the link found on the left side of the web page under the heading "Lesson 1" or by clicking on the links "1.5.2 – Measures of Position" and "1.5.3 – Measures of Variability" found at the end of the text on the bottom right-hand side of the web page.
- Understand the implications and uses of normality and skewness.
-
Students mustMark as done
- Data on newborns, such as gestational age and birthweight, can be helpful in establishing baseline health statuses for maternal and infant health. Premature births and low birthweights can be detrimental to an infant’s development. For Mexican-American infants born in the state of Arizona in 1986 and 1987, the probability that an infant’s gestational age is less than 37 weeks is 0.142 and the probability that his or her birthweight is less than 2,500 grams is 0.051. Furthermore, the probability that these two events occur simultaneously is 0.031.
- Let A be the event that an infant’s gestational age is less than 37 weeks and B the event that his or her birthweight is less than 2,500 grams. Construct a Venn diagram to illustrate the relationship between events A and B.
- For a randomly selected Mexican-American newborn, what is the probability that A or B or both occur?
- What is the probability that event A occurs given that event B occurs?
- Are A and B independent? Justify your answer mathematically.
- Following an industrial accident, lead concentrations in the air of a nearby factory were measured at multiple locations. The factory was divided into 1,000 equal spaces, and 100 measurements were used to estimate the mean and standard deviation. It was concluded that the lead concentrations followed an approximately normal distribution, and the sample mean levels of lead were 1.15μg/m3 with a sample standard deviation of 0.32 μg/m3. Note that the local environmental safety regulation states that levels above 1.50 μg/m3 are dangerous to health. Assuming a normal distribution and using the sample values for mean and standard deviation,
- What is the probability that concentrations exceed the safety limit imposed by regulations?
- We want to further study contaminated locations with lead concentrations that fell in the middle 70%. What lead concentrations did they have?
- Be able to calculate and correctly interpret probability data from a sampling distribution.
-
Students mustViewReceive a gradeReceive a passing grade
To access the quiz, click on the name of the quiz provided above. On the following screen, click the "Preview quiz now" button to view the case studies and respond to the questions.
-
Answer key. Probability and Sampling Distributions FileNot available unless: The activity Peer Activity 1: Probability and Sampling Distributions Problem 1 is marked complete ...Not available unless:
- The activity Peer Activity 1: Probability and Sampling Distributions Problem 1 is marked complete
- The activity Peer Activity 2: Probability and Sampling Distributions Problem 2 is marked complete
24.7 KB
-
Competencies covered in this module

- Distinguish among the different measurement scales and the implications for selection of statistical methods to be used based on these distinctions.
- Apply common statistical methods for inference.
- Apply descriptive and inferential methodologies according to the type of study design for answering a particular research question.
-
Students mustMark as done
In this short module, we build on the concept of sampling distributions to use samples to make inferences on the population. We will start by understanding inference and estimation, then learn to calculate confidence intervals. We will also look at factors and conditions that influence estimation.
In contrast to an orderly presentation such as in previous modules, most of the resources in this module cover the same key concepts in slightly different ways.
Upon completion of this module, students should be able to:
- Understand and be able to apply point estimation and confidence interval estimation
- Recognize inference on means versus inference on proportions
- Be able to calculate one-sided and two-sided confidence intervals for mean and proportion
- Understand the effect of sample size and other conditions on estimation, as well as understand and be able to calculate the sample size needed to achieve the desired confidence level
-
Learning Objectives
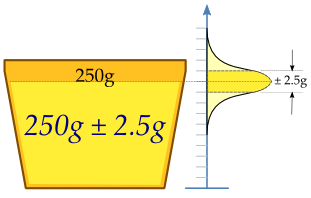
- Understand and be able to apply point estimation and confidence interval estimation.
- Recognize inference on means versus inference on proportion.
- Be able to calculate one-sided and two-sided confidence intervals for mean and proportion.
-
Required Learning Resources and Activities
-
Students mustView
- Read the web page. Then, access the lessons "Degrees of Freedom" and "Characteristics of Estimators" by clicking on the links titled "Standard" found on the left side of the web page under the headings "3. Degrees of Freedom" and "4. Characteristics of Estimators" in the section "Chapter X. Estimation". Read the content of those links.
- Understand and be able to apply point estimation and confidence interval estimation.
-
Students mustView
- Read the web page, as well as the content of sections 4.2.1 (Interpreting Confidence Intervals) and 4.2.2 (Application of Confidence Intervals). Access sections 4.2.1 and 4.2.2 by clicking on the appropriate links found on the left side of the web page.
- Understand and be able to apply point estimation and confidence interval estimation.
-
Students mustView
- Download the PDF version of the text by clicking on the appropriate link. Then, read the introductory section to Chapter 8, as well as sections 8.1 to 8.3 (pages 443–467). Sections 8.4 to 8.6 are considered optional reading.
- Recognize inference on means versus inference on proportion.
-
Students mustView
- Read slides 2–8.
- Be able to calculate one-sided and two-sided confidence intervals for mean and proportion.
-
Students mustView
- Read to the end of slide 24.
- Be able to calculate one-sided and two-sided confidence intervals for mean and proportion.
- Read to the end of slide 24.
-
Students mustViewReceive a gradeReceive a passing grade
To access the quiz, click on the name of the quiz provided above. On the following screen, click the "Preview quiz now" button to view the case studies and respond to the questions.
-
Additional Learning Options
-
Students mustView
- Read the web page, as well as the content of section 9.2 (Confidence Intervals for a Population Mean). Access section 9.2 by clicking on the link "9.2 – Confidence Intervals for a Population Mean" found on the left side of the web page.
-
Learning Objective

- Understand the effect of sample size and other conditions on estimation as well as understand and be able to calculate the sample size needed to achieve the desired confidence level.
-
Required Learning Resources and Activities
-
Students mustView
- Read the web page. Then, click on pages 2, 3, and 4, and read the content of each page.
- Understand the effect of sample size and other conditions on estimation as well as understand and be able to calculate the sample size needed to achieve the desired confidence level.
-
Students mustView
- Read the web page. Then, on the left hand side of the web page, click on the link titled "Standard" found under each of the following six headings: "8. Confidence Interval for Mean", "9. t distribution", "10. Confidence Interval Simulation", "11. Difference between Means", "12. Correlation", and "13. Proportion". Read the content of those web pages.
- Understand the effect of sample size and other conditions on estimation as well as understand and be able to calculate the sample size needed to achieve the desired confidence level.
-
Students mustViewReceive a gradeReceive a passing grade
To access the quiz, click on the name of the quiz provided above. On the following screen, click the "Preview quiz now" button to view the case studies and respond to the questions.
-
Competencies covered in this module:

- Describe preferred methodological alternatives to commonly used statistical methods when assumptions are not met.
- Apply common statistical methods for inference.
- Apply descriptive and inferential methodologies according to the type of study design for answering a particular research question.
-
Students mustMark as done
Hypothesis testing is a cornerstone in science. In biostatistics, it is often used to assess anything from the effectiveness of an intervention, to changes in the distribution of a health outcome. But many tests are out there, so how do they work? When do you use which? How does hypothesis testing differ from estimation and from regression modeling? We will answer these questions in this module. The concept of hypothesis testing may appear counter-intuitive at first, but this is the common “frequentist” approach of statistics; other approaches exist that are beyond the scope of this course. Pictures can help a great deal in understanding ideas such as the null and alternate hypotheses, power, types of errors, etc.
These days most calculations for hypothesis testing, power, and sample size calculations are performed using statistical software. It is still very important that you understand the fundamental theory underlying these concepts and which quantities influence these values; however, there is less emphasis on your ability to do hand calculations.
What you should know:
- Write hypothesis statements
- Choose the appropriate test
- Interpret results of the hypothesis test
What software can do:
- Run the hypothesis test chosen by you (e.g., calculate test statistic, report p-value)
- Calculate sample size given other values (e.g., desired power, effect size)
Several resources in this module cover the same topics but with different approaches. Reading about different ways to explain the same complex concept may help you find what speaks to you best. Utilize as many resources as needed to understand key concepts in this module.
Statistics is a hands-on discipline. The learning activity in this module asks you to run through some hypothesis tests from beginning to end. You should be able to perform calculations by hand and arrive at a conclusion. For more complex tests, you will likely need the assistance of statistical packages to do the bulk of the work for you.
Upon completion of this module, students should be able to:
- Reinforce understanding of probability distributions in the context of hypothesis testing, especially in drawing conclusions and types of errors
- Distinguish types of explanatory and response variables
- Understand the relationship between confidence interval and hypothesis testing
- Understand and apply hypothesis tests for a single mean and a single proportion as well as for two means (independent and paired/matched samples), and understand chi-squared test and ANOVA
- Understand inference, estimation, and the basics of hypothesis testing
- Understand implications of multiple testing and Bonferroni correction
- Understand and be able to correctly interpret p-values
- Understand the importance and implications of Type I and Type II errors
- Understand factors that affect study power and sample size requirements, and how they impact study design
- Summarize and describe nonparametric tests and understand the conditions under which they are applied
- Be able (1) to apply appropriate hypothesis tests to variable types in order to explore relationships and (2) to draw conclusions based on such hypothesis testing and to interpret p-values
-
Learning Objectives
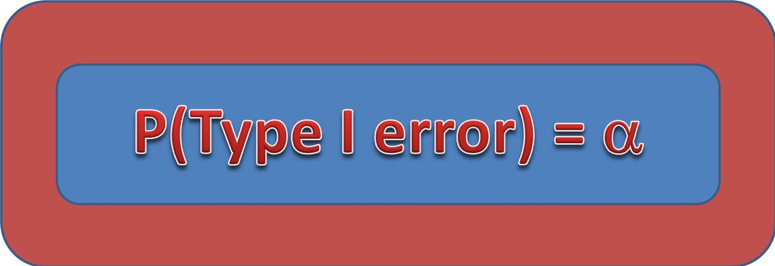
- Reinforce understanding of probability distributions in the context of hypothesis testing, especially in drawing conclusions and types of errors.
- Distinguish types of explanatory and response variables.
- Understand the relationship between confidence interval and hypothesis testing.
-
Required Learning Resources and Activities
-
Students mustView
- Read the web page, as well as the content of sections S.3.1 to S.3.3. Access sections S.3.1, "Hypothesis Testing (Critical value approach)", S.3.2, "Hypothesis Testing (P-Value Approach)", and S.3.3, "Hypothesis Testing: Examples" by clicking on the titled links found on the left side of the web page.
- Reinforce understanding of probability distributions in the context of hypothesis testing, especially in drawing conclusions and types of errors.
-
Students mustView
- Read the web page. Then, on the left-hand side of the web page, click on the link titled "Standard" found under the heading "4. Type I and Type II Errors". Read the content of that web page.
- Reinforce understanding of probability distributions in the context of hypothesis testing, especially in drawing conclusions and types of errors.
-
Students mustView
- Read the entire web page.
- Distinguish types of explanatory and response variables.
-
Students mustView
- Read the entire web page.
- Distinguish types of explanatory and response variables.
-
Students mustView
- Read the entire web page.
- Understand the relationship between confidence interval and hypothesis testing.
-
Students mustViewReceive a gradeReceive a passing grade
To access the quiz, click on the name of the quiz provided above. On the following screen, click the "Preview quiz now" button to view the case studies and respond to the questions.
-
Additional Learning Options
-
- Read from the beginning of the article to the beginning of the section titled “Question 1. Is there a difference between groups or data sets that are unpaired (parallel or independent)?”.
-
Students mustView
- Read the web page.
-
Learning Objectives
- Understand and apply hypothesis tests for a single mean and a single proportion as well as for two means (independent and paired/matched samples), and understand chi-squared test and ANOVA.
- Understand inference, estimation, and the basics of hypothesis testing.
- Understand implications of multiple testing and Bonferroni correction.
- Understand and be able to correctly interpret p-values.
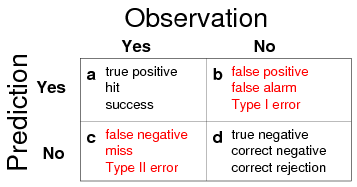
- Understand the importance and implications of Type I and Type II errors.
-
Required Learning Resources and Activities
-
Students mustView
- Download the PDF version of the text by clicking on the appropriate link. Then, in Chapter 9, "Hypothesis Testing with One Sample", read the introductory page as well as sections 9.1 to 9.5 (pages 505–530).
- Understand and apply hypothesis tests for a single mean and a single proportion as well as for two means (independent and paired/matched samples), and understand chi-squared test and ANOVA.
-
Students mustView
- Download the PDF version of the text by clicking on the appropriate link. Then, in Chapter 10, "Hypothesis Testing with Two Samples", read sections 10.1 and 10.2 (pages 568–579). Work through the exercises to strengthen your understanding.
- Understand and apply hypothesis tests for a single mean and a single proportion as well as for two means (independent and paired/matched samples), and understand chi-squared test and ANOVA.
-
Students mustView
- Download the PDF version of the text by clicking on the appropriate link. Then, in Chapter 10, "Hypothesis Testing with Two Samples", read section 10.3 to the end of Chapter 10 (pages 579–590). Work through the exercises to strengthen your understanding.
- Understand and apply hypothesis tests for a single mean and a single proportion as well as for two means (independent and paired/matched samples), and understand chi-squared test and ANOVA.
-
Students mustView
- Read the entire web page.
- Understand and apply hypothesis tests for a single mean and a single proportion as well as for two means (independent and paired/matched samples), and understand chi-squared test and ANOVA.
-
Students mustView
- Read the web page, as well as the entire content of sections 10.1 (Introduction to Analysis of Variance), 10.2 (A Statistical Test for One-Way ANOVA), 10.2.1 (ANOVA Assumptions), 10.2.2 (The ANOVA Table), 10.3 (Multiple Comparisons), 10.4 (Two-Way ANOVA), and 10.5 (Summary). Access each section in Chapter 10 by clicking on the titled links found on the left side of the web page under the heading "Lesson 10: Introduction to ANOVA".
- Understand and apply hypothesis tests for a single mean and a single proportion as well as for two means (independent and paired/matched samples), and understand chi-squared test and ANOVA.
-
Students mustView
- Read pages 6.1-1–6.1-14 and 6.1-31–6.1-34.
- Understand inference, estimation, and the basics of hypothesis testing.
-
Students mustView
- Read pages 6.2-1–6.2-7 and 6.2-11–6.2-14.
- Understand inference, estimation, and the basics of hypothesis testing.
-
Students mustView
- Read the entire article.
- Understand implications of multiple testing and Bonferroni correction.
-
Students mustView
- Read the entire article.
- Understand and be able to correctly interpret p-values.
-
Students mustView
- Read the entire article.
- Understand the importance and implications of Type I and Type II errors.
-
Students mustViewReceive a gradeReceive a passing grade
To access the quiz, click on the name of the quiz provided above. On the following screen, click the "Preview quiz now" button to view the case studies and respond to the questions.
-
Additional Learning Options
-
Students mustView
- Read the entire article.
-
Learning Objective
- Understand factors that affect study power and sample size requirements, and how they impact study design.
-
Required Learning Resources and Activities
-
-
Students mustView
- Read the entire article.
- Understand factors that affect study power and sample size requirements, and how they impact study design.
-
Students mustViewReceive a gradeReceive a passing grade
To access the quiz, click on the name of the quiz provided above. On the following screen, click the "Preview quiz now" button to view the case studies and respond to the questions.
-
Additional Learning Options
-
Students mustView
- Read the entire article.
-
Students mustView
- Read the entire article.
-
Students mustView
- Read the entire article.
-
Learning Objectives
- Summarize and describe non-parametric tests and understand the conditions under which they are applied.
- Be able (1) to apply appropriate hypothesis tests to variable types in order to explore relationships and (2) to draw conclusions based on such hypothesis testing and to interpret p-values.
-
Required Learning Resources and Activities
-
Students mustView
- Read the web page. Then, click on pages 2 through 8 and read the content of each page.
- Summarize and describe nonparametric tests and understand the conditions under which they are applied.
-
Students mustView
- Read the entire article.
- Summarize and describe non-parametric tests and understand the conditions under which they are applied.
-
Students mustView
- Read the entire article.
- Summarize and describe nonparametric tests and understand the conditions under which they are applied.
-
Students mustViewReceive a gradeReceive a passing grade
To access the quiz, click on the name of the quiz provided above. On the following screen, click the "Preview quiz now" button to view the case studies and respond to the questions.
-
Additional Learning Options
-
Students mustView
- Scroll down and read the section "Power of Study". This section outlines "How to Choose an Appropriate Statistical Test" as well as "Common problems faced by researchers in any trial and how to address them". The rest of this article is considered optional reading.
-
-
Students mustViewStart discussions: 1
Step 1: Read this paragraph about cancer screening tests.
Cancer screening is an important part of secondary prevention in public health. If a patient receives a positive result on a relatively low-cost screening test, he/she may need further, more specific, or invasive testing to confirm a diagnosis. Public health programs need to balance many factors in choosing appropriate screening tests.
Step 2: Based on the following paragraph: “A regional cancer agency found out that, in the past, about 10% of women with a positive result on a mammogram may need further tests. The agency conducts a survey to find out if this number has changed in the current year. The survey is conducted on 200 women, among which 21 went on to get further testing.” Conduct a full hypothesis test at α=0.05 and construct a 95% CI. Assume the sample is randomly selected and observations are independent. Write a paragraph explaining your methods and summarizing your findings.
Step 3: Include your results in a document along with a paragraph explaining your methods and summarizing your findings. Make sure to include the software or additional tools you used.
Step 4: Before you submit, analyze your work using the following questions:
- Have I clearly explained my methods and summarized my findings in the paragraph?
- Is the process I followed to solve the problems clearly detailed, indicating that I have worked through them independently?
- How could I improve the process to solve the questions of step two?
- Are there any additional tools or resources that could aid me in solving this type of problem in the future?
Step 5: Submit your assignment to the designated course platform area by clicking “add a new discussion topic” below and completing the fields. Make sure to upload the document that contains your work, do NOT paste your work in the Description box.
OPTIONAL Step 6: Interact (10 minutes)
If you would like to, you can reply to your peers' posts in a respectful and professional manner. Ensure that your post engages your peers' ideas by including a reflection on their comments, sharing ideas of other potential difficulties and parties involved, or asking thought-provoking questions. If a peer comments on your posting, please reply. To post a reply, click “Reply” on a particular discussion, write your feedback and then click on “Post to forum.”
-
Students mustViewStart discussions: 1
Step 1: Read the information about illegal drugs (heroin) and their negative effect on pulse rate.
Illegal drugs can be dangerous for many reasons, one of which is their ability to modify physiological signs such as pulse rate. We want to know whether heroin users’ pulse rates are affected by the drug. The typical average adult resting pulse rate is 80 bpm (beats per minute). By comparison, a group of 30 heroin users had a mean pulse rate of 65±10 bpm half an hour after consuming the drug.
Step 2: Conduct a full hypothesis test at α=0.05 and construct a 95% CI. Assume the sample is randomly selected and observations are independent. Write a paragraph explaining your methods and summarizing your findings.
Step 3: Include your results in a document along with a paragraph explaining your methods and summarizing your findings. Make sure to include the software or additional tools you used.
Step 4: Submit your assignment for peer review by clicking “add a new discussion topic” below and completing the fields. Make sure to upload the document that contains your work, do NOT paste your work in the Description box.
Step 5: Review the work of your peer by asking yourself the questions listed below and comment on his post stating that their post meets these requirements.
- Did my peer write a paragraph explaining his/her methods and summarizing his/her findings?
- Did my peer explain the process he followed in a way that it is clear he solved the problems by himself/herself?
- How could my peer improve the process to solve the questions of step two?
- What tools can I suggest to my peers to solve this kind of problem?
OPTIONAL Step 6: Interact (10 minutes)
If you would like to, you can reply to your peers' posts in a respectful and professional manner. Ensure that your post engages your peers' ideas by including a reflection on their comments, sharing ideas of other potential difficulties and parties involved, or asking thought-provoking questions. If a peer comments on your posting, please reply. To post a reply, click “Reply” on a particular discussion, write your feedback and then click on “Post to forum.”
-
Students mustViewStart discussions: 1
Step 1: Read the following text about the effect of birth weight on depression among women.
A recent psychiatric study observed a higher incidence of depression among women whose birth weight was less than 6.6 pounds than in women whose birth weight was over 6.6 pounds. Based on a p-value of 0.0248, the researchers concluded there was evidence that low birth weight may be a risk factor for susceptibility to depression.
Step 2: Write a paragraph explaining what the reported p-value means in this context.
Step 3: In reviewing your work, consider the following points to ensure your assignment meets the necessary criteria before submission:
- Have I written a paragraph that clearly explains what the reported p-value means in the context of the psychiatric study?
- Are my explanations accurate, sufficient, and articulated in a way that can be easily understood?
- In what ways might I enhance the clarity, conciseness, or informative value of my writing assignment?
After completing your self-assessment, revise your document as needed to reflect these considerations. Once you are satisfied with your work, submit the final version to the designated area of the course platform.
Step 4: Submit your assignment to the designated course platform area by clicking “add a new discussion topic” below and completing the fields. Make sure to upload the document that contains your work, do NOT paste your work in the Description box.
OPTIONAL Step 5: Interact (10 minutes)
If you would like to, you can reply to your peers' posts in a respectful and professional manner. Ensure that your post engages your peers' ideas by including a reflection on their comments, sharing ideas of other potential difficulties and parties involved, or asking thought-provoking questions. If a peer comments on your posting, please reply. To post a reply, click “Reply” on a particular discussion, write your feedback and then click on “Post to forum.”
-
Students mustViewStart discussions: 1
Step 1: Read the text about Alzheimer tests.
Testing for Alzheimer’s disease can be a long and expensive process. Recently, a group of researchers devised a 7-minute test to serve as a quick screening test for the disease and to be used in the general population of senior citizens. A patient who tested positive should then go through the more expensive battery of tests. The authors reported a false positive rate of 4% and a false negative rate of 8%.
Step 2: In the three activities below you have to apply appropriate hypothesis tests, identify types of hypotheses, and interpret the results.
- Put this in the context of a hypothesis test.
- What are the null and the alternative hypotheses?
- What would a Type I error mean in context? What would a Type II error mean in context?
Step 3: Include your results in a document along with a paragraph explaining your methods and summarizing your findings.
Step 4: Use the provided self-reflection questions to review your own work. Consider the following and make any necessary revisions before finalizing your submission:
- Have I successfully answered the three questions regarding hypothesis testing, types of hypotheses, and the implications of Type I and Type II errors in context?
- Is my explanatory process clear and detailed enough to demonstrate independent problem-solving and understanding of the concepts?
- In what ways might I refine my approach to these types of problems for greater clarity or efficiency?
Step 5: Submit your assignment to the designated course platform area by clicking “add a new discussion topic” below and completing the fields. Make sure to upload the document that contains your work, do NOT paste your work in the Description box.
OPTIONAL Step 6: Interact (10 minutes)
If you would like to, you can reply to your peers' posts in a respectful and professional manner. Ensure that your post engages your peers' ideas by including a reflection on their comments, sharing ideas of other potential difficulties and parties involved, or asking thought-provoking questions. If a peer comments on your posting, please reply. To post a reply, click “Reply” on a particular discussion, write your feedback and then click on “Post to forum.”
-
Answer key. Probability and Sampling Distributions FileNot available unless: The activity Asynchronous Learning Activity 3: Hypothesis Testing Problem 1 is marked complete ...Not available unless:
- The activity Asynchronous Learning Activity 3: Hypothesis Testing Problem 1 is marked complete
- The activity Peer Activity 4: Hypothesis Testing Problem 2 is marked complete
- The activity Asynchronous Learning Activity 5: Hypothesis Testing Problem 3 is marked complete
- The activity Asynchronous Learning Activity 6: Hypothesis Testing Problem 4 is marked complete
56.3 KB
-
Competencies covered in this module:

- Apply common statistical methods for inference.
- Apply descriptive and inferential methodologies according to the type of study design for answering a particular research question.
-
Students mustMark as done
In the previous module, we learned methods we could use to decide whether to reject a null hypothesis based on the evidence we have. However, what if we want more than a simple yes/no answer and wish to precisely predict how the outcome changes as the predictors change? This is the reason we use regression models, as we will learn in this module. This module has four lessons, and the division is based on the nature of the outcome variable: if it is a continuous variable, we use simple or multiple linear regression; if it is a binary categorical variable, we use logistic regression. These represent some very common and basic statistical models; there are many more regression methods in the field, but learning the basic concepts well will help you quickly pick up other methods when you need to. You will notice that some concepts cross over from epidemiology, such as risk, odds, confounding, bias, etc. It is helpful to possess some prior knowledge in epidemiology, but if you don’t, these concepts will also be explained in this module.
Resources on regression can vary a great deal in their depth and complexity. Don’t let the math scare you. Focus on the main ideas to start, and add the mathematical details as you continue progressing in the topic.
The learning activity in this module asks you to go through some regression models. Even more so than hypothesis testing, the tedious calculation parts are done by the computer, but you will need to answer questions about the model and about using the model. These are essential skills that you will need in order to understand research literature and reports.
Upon completion of this module, students should be able to:
- Understand linear relationships, outliers, and the basics of correlation
- Understand the difference between correlation and simple linear regression, and when to apply one or the other
- Understand homoscedasticity and its applications to correlation and regression
- Understand linear regression and how it relates to prediction
- Understand multiple linear regression and its applications
- Understand simple logistic regression analysis
- Understand multiple logistic regression analysis and distinguish between adjusted and unadjusted regression coefficients
- Be able (1) to distinguish between risks, e.g., absolute and relative risks, as well as odds and odds ratios, and (2) to differentiate relative risks from odds ratios and know how to conduct both methods
- Be able (1) to distinguish between correlation, linear and multiple regression, and logistic regression, and (2) to understand the purpose and methods of linear (simple and multiple) and logistic regression, including when to use each of them
- Be able to specify regression models and interpret regression results
-
Learning Objectives
- Understand linear relationships, outliers, and the basics of correlation.
- Understand the difference between correlation and simple linear regression, and when to apply one or the other.
- Understand homoscedasticity and its applications to correlation and regression.
- Understand linear regression and how it relates to prediction.
-
Required Learning Resources and Activities
-
Students mustView
- Download the PDF version of the text by clicking on the appropriate link. Then, in Chapter 12 titled "Linear Regression and Correlation", read the introductory section along with sections 12.1, 12.2, 12.3, and 12.6 (pages 679-691 and 697-704).
- Understand linear relationships, outliers, and the basics of correlation
-
- Read down to the beginning of the section titled "How the test works".
- Understand the difference between correlation and simple linear regression, and when to apply one or the other
-
Students mustView
- Read the web page as well as sections 1.2 and 1.3. Access sections 1.2 (What is the "Best Fitting Line"?) and 1.3 (The Simple Linear Regression Model) by clicking on the titled links found on the left side of the web page.
- Understand the difference between correlation and simple linear regression, and when to apply one or the other
-
-
Students mustView
- Read the web page as well as sections 2.1 to 2.5. Access sections 2.1 (Inference for the Population Intercept and Slope), 2.2 (Another Example of Slope Inference), 2.3 (Sums of Squares), 2.4 (Sums of Squares (continued)), and 2.5 (Analysis of Variance: The Basic Idea) by clicking on the titled links found on the left side of the web page.
- Understand the difference between correlation and simple linear regression, and when to apply one or the other
-
Students mustView
- Scroll down and read the section titled "Assumptions" to understand the definition of Homoscedasticity.
- Understand homoscedasticity, and its applications to correlation and regression
-
Students mustView
- Read the web page as well as sections 3.1 to 3.3. Access sections 3.1 (The Research Questions), 3.2 (Confidence Interval for the Mean Response), and 3.3 (Prediction Interval for a New Response) by clicking on the titled links found on the left side of the web page.
- Understand linear regression and how it relates to prediction
-
Students mustView
- Read the web page as well as sections 4.1 to 4.8. Access sections 4.1 (Background), 4.2 (Residuals vs. Fits Plot), 4.3 (Residuals vs. Predictor Plot), 4.4 (Identifying Specific Problems Using Residual Plots), 4.5 (Residuals vs. Order Plot), 4.6 (Normal Probability Plot of Residuals), 4.7 (Assessing Linearity by Visual Inspection), and 4.8 (Further Examples) by clicking on the titled links found on the left side of the web page.
- Understand linear regression and how it relates to prediction
-
Students mustViewReceive a grade
To access the quiz, click on the name of the quiz provided above. On the following screen, click the "Preview quiz now" button to view the case studies and respond to the questions.
-
Additional Learning Options
-
Students mustView
- Read the entire article.
-
- Download the PDF version of the text by clicking on the appropriate link. Then, read sections 12.4 and 12.5 titled "Testing the Significance of the Correlation Coefficient" and "Prediction" respectively (pages 691-697).
-
Learning Objective
- Understand multiple linear regression and its applications.
-
Required Learning Resources and Activities
-
Students mustView
- Scroll down to the heading titled "Module 2: Linear Regression", and click on the PDF links to parts A to E of Lecture 5 (Relating a Continuous Outcome to More than One Predictor: Multiple Linear Regression). Read the slides. An audio recording of the presentation is also available.
- Understand multiple linear regression and its applications
-
Students mustView
- Read the web page as well as sections 5.1 to 5.3. Access sections 5.1 (Example on IQ and Physical Characteristics), 5.2 (Example on Underground Air Quality), and 5.3 (The Multiple Linear Regression Model) by clicking on the titled links found on the left side of the web page.
- Understand multiple linear regression and its applications
-
Students mustViewReceive a grade
To access the quiz, click on the name of the quiz provided above. On the following screen, click the "Preview quiz now" button to view the case studies and respond to the questions.
-
Learning Objectives
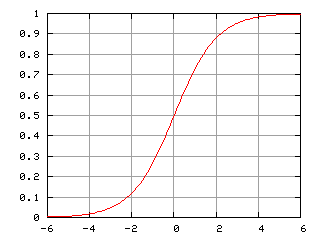
- Understand simple logistic regression analysis.
- Understand multiple logistic regression analysis and distinguish between adjusted and unadjusted regression coefficients.
- Be able (1) to distinguish between risks, e.g., absolute and relative risks, as well as odds and odds ratios, and (2) to differentiate relative risks from odds ratios and know how to conduct both methods.
-
Required Learning Resources and Activities
-
-
-
Students mustView
- Read the web page (section 15.1) as well as sections 15.2 to 15.3. Access sections 15.2 (Polytomous Regression) and 15.3 (Further Logistic Regression Examples) by clicking on the titled links found on the left side of the web page.
- Understand multiple logistic regression analysis and distinguish between adjusted and unadjusted regression coefficients
-
Students mustView
- Read the entire article.
- Be able (1) to distinguish between risks, absolute and relative risks, as well as odds and odds ratios, and (2) to differentiate relative risks from odds ratios and know how to conduct both methods
-
Students mustView
- Read the entire article.
- Be able (1) to distinguish between risks, absolute and relative risks, as well as odds and odds ratios, and (2) to differentiate relative risks from odds ratios and know how to conduct both methods
-
Students mustView
- Read the entire web page.
- Be able (1) to distinguish between risks, absolute and relative risks, as well as odds and odds ratios, and (2) to differentiate relative risks from odds ratios and know how to conduct both methods
-
Students mustViewReceive a grade
To access the quiz, click on the name of the quiz provided above. On the following screen, click the "Preview quiz now" button to view the case studies and respond to the questions.
-
Additional Learning Options
-
Students mustView
- Read the entire article.
-
- Read the web page (section 15.4) as well as sections 15.5 to 15.8. Access sections 15.5 (Generalized Linear Models), 15.5 (Nonlinear Regression), 15.7 (Exponential Regression Example), and 15.8 (Population Growth Example) by clicking on the titled links found on the left side of the web page.
-
Learning Objectives
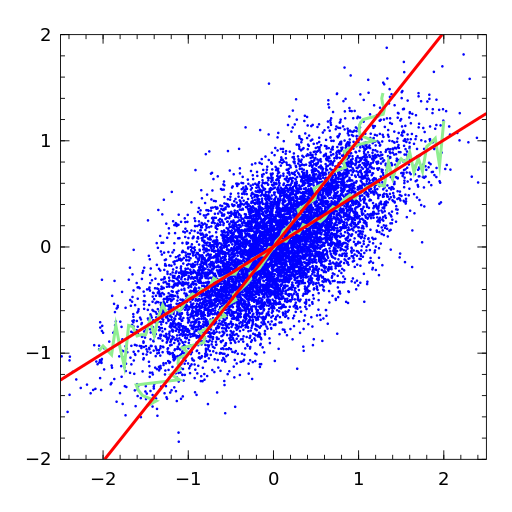
- Be able (1) to distinguish between correlation, linear and multiple regression, and logistic regression, and (2) to understand the purpose and methods of linear (simple and multiple) and logistic regression, including when to use each of them.
- Be able to specify regression models and interpret regression results.
-
Required Learning Resources and Activities
-
- Read the entire article.
- Be able (1) to distinguish between correlation, linear and multiple regression, as well as logistic regression, and (2) to understand the purpose and methods of linear (simple and multiple) and logistic regression including when to use each of them
-
Students mustViewReceive a grade
- The fitted equation from a study on infant head circumference is as follows:
head circumference = 1.76 + 0.86×gestational age - 2.82×toxemia
+ 0.046×(gestational age×toxemia)
where gestational age is measured in weeks and toxemia is an indicator variable for the mother’s toxemia status during pregnancy (1=had toxemia).
- For infants whose mothers did not have toxemia during pregnancy, what is the effect of an extra two weeks of gestation? What about for those whose mothers had toxemia?
- What other information or calculations would you need to decide whether to include this effect in the final model?
- What effect does the last term represent? How would you interpret this effect?
- Be able to specify regression models and interpret regression results
-
Students mustViewReceive a grade
- Consider the following hypothetical scenario: Two experimental treatments (A and B) are administered to patients having just suffered a stroke. After a few months, the following data is obtained (Table 1). A multivariate logistic regression model is later constructed from this data (Table 2). Answer questions 1-9 based on this information.
Table 1: Effect of treatment on stroke survival by smoking statusPatients
Treatment A
Treatment B
Total
Non-smokers
No. of deaths
46
8
54
No. of survivors
105
37
142
Total
151
45
196
Smokers
No. of deaths
105
15
120
No. of survivors
160
81
241
Total
265
96
361
Table 2: Results from a multivariate logistic regression based on data from Table 1 (Reference group = non-smokers, treatment B)Parameter
Fitted value of β
Intercept
(Ref. group: non-smoker, treatment B)β0 = -1.856
Smoking status
β1 = 0.314
Treatment option
β2 = 1.090
Questions- From Table 1, calculate the odds ratio of death for non-smokers under treatment A .
- From Table 1, calculate the odds ratio of death for smokers under treatment B.
- Explain in words what these odds ratios mean.
- From Table 2, write the corresponding multivariate logistic regression equation. Indicate what the variables mean and which values they can take.
- Calculate the odds of death and the probability of death for non-smokers under treatment B.
- Calculate the odds of death and the probability of death for smokers under treatment B.
- Calculate the odds of death and the probability of death for non-smokers under treatment A.
- Calculate the odds of death and the probability of death for smokers under treatment A.
- What is the sum of all the probabilities?
- Be able to specify regression models and interpret regression results
-
Students mustViewReceive a grade
To access the quiz, click on the name of the quiz provided above. On the following screen, click the "Preview quiz now" button to view the case studies and respond to the questions.
-
Additional Learning Options
-
- Read the entire article.
-
Answer key. Linear regression problem 1 FileNot available unless: The activity Peer Activity 7: Linear Regression Problem 1 is marked complete17.9 KB
-
Answer key. Linear regression problem 2 FileNot available unless: The activity Peer Activity 8: Linear Regression Problem 2 is marked complete28.9 KB
-
Competency covered in this module:

- Describe the roles biostatistics serves in the discipline of public health.
- Apply common statistical methods for inference.
-
Students mustMark as done
Health phenomena are complex. Often there are variables that interact with the variables in our primary relationship of interest. In order to understand how these other variables influence the primary association and to be sure that the effect we find actually reflects the relationship we are interested in, we can use some statistical tools to help us. This short module offers an introductory look at how to use biostatistics to identify the nature and extent of these influences. These tools are best used in conjunction with domain expertise; therefore, it is important that you also understand the context of a particular research question or a relationship.
The learning activity in this module is a mentored activity that ties together several aspects of statistical analysis in the context of a research project. We hope that through discussions with your mentor, you can further your understanding of these tools and see them in action.
Upon completion of this module, students should be able to:
- Know the definition of a confounder and understand the concepts of adjustment and stratification, as well as the concepts of confounding and effect modification
- Identify the statistical techniques for dealing with confounding and effect modification and their strengths and limitations
- Be able to comment on the validity of study conclusions with respect to confounding and alternative explanations and appreciate that association neither means causation nor indicates the directionality of potential cause and effect
- Identify potential confounders in a relationship from a theoretical perspective and understand the consequences of using faulty reasoning and improper methods in studies
- Apply analytical statistics in the context of a research project and be able to think critically about practical application of statistical concepts
-
Learning Objectives
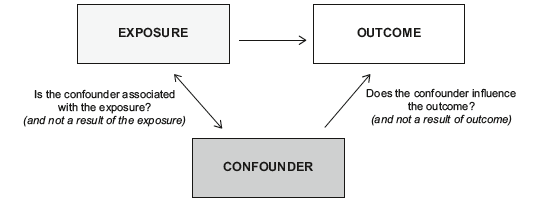
- Know the definition of a confounder and understand the concepts of adjustment and stratification, as well as the concepts of confounding and effect modification.
- Identify the statistical techniques for dealing with confounding and effect modification and their strengths and limitations.
-
Required Learning Resources and Activities
-
Students mustView
- Read the web page.
- Know the definition of a confounder, and understand the concepts of adjustment and stratification, as well the concepts of confounding and effect modification
-
Students mustViewRead the entire article.
-
Students mustView
- Read the web page. Then, click on pages 4-9 and read the content of each page.
- Identify the statistical techniques for dealing with confounding and effect modification, their strengths and limitations
-
Students mustViewReceive a grade
To access the quiz, click on the name of the quiz provided above. On the following screen, click the "Preview quiz now" button to view the case studies and respond to the questions.
-
Additional Learning Options
-
- Read the entire web page.
-
- Read the entire web page.
-
- Read the entire document.
-
- Read the entire document.
-
Learning Objectives
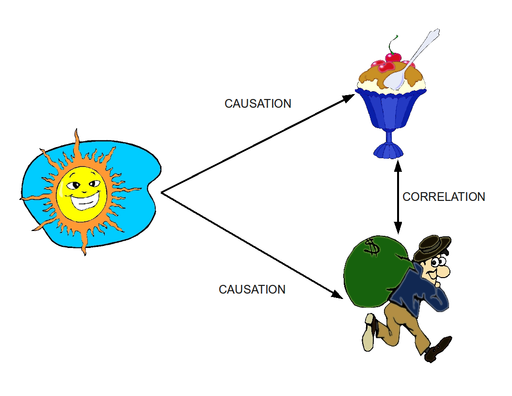
- Be able to comment on the validity of study conclusions with respect to confounding and alternative explanations and appreciate that association neither means causation nor indicates the directionality of potential cause and effect.
- Identify potential confounders in a relationship from a theoretical perspective and understand the consequences of using faulty reasoning and improper methods in studies.
- Apply analytical statistics in the context of a research project and be able to think critically about practical application of statistical concepts.
-
Required Learning Resources and Activities
-
Students mustView
- Read the entire article.
- Be able to comment on the validity of study conclusions with respect to confounding and alternative explanations and appreciate that association neither means causation nor indicates the directionality of potential cause and effect
-
Students mustView
- Read the entire article.
- Identify potential confounders in a relationship from a theoretical perspective and understand the consequences of using faulty reasoning and improper methods in studies
-
Students mustViewMake a submission
- Find a local public health professional; someone who is involved with a health-related research project using quantitative methodologies (i.e. not purely qualitative studies) and learn about their project. Focus on the questions below, but also ask other relevant questions that can help you better understand the project and statistical methods used.
- Research question
- What is your research question?
- What are the null and alternative hypotheses?
- What is/are your outcome variable(s) and your explanatory variable(s), and how are they measured?
- How do you account for bias and confounding?
- Analysis steps
- What descriptive statistical methods do you use?
- What analytical methods do you use?
- How did you choose these methods?
- Are there alternative methods you could use? What are their advantages and limitations?
- Apply analytical statistics in the context of a research project and be able to think critically about practical application of statistical concepts
-
Students mustViewReceive a grade
To access the quiz, click on the name of the quiz provided above. On the following screen, click the "Preview quiz now" button to view the case studies and respond to the questions.
-

Competency covered in this module:
- Describe the roles biostatistics serves in the discipline of public health.
- Apply descriptive and inferential methodologies according to the type of study design for answering a particular research question.
- Apply basic informatics techniques with vital statistics and public health records in the description of public health characteristics and in public health research and evaluation.
- Interpret results of statistical analyses found in public health studies.
- Develop written and oral presentations based on statistical analyses for both public health professionals and educated lay audiences.
-
Students mustMark as done
As we come to the end of this course, it is time to review the major concepts in the context of public health research and practice. In this module, we will look at the importance of evidence-based decision-making, along with some tips and advice on how to read public health literature to spot misleading claims and inappropriate methods. Finally, we will look at two examples of how biostatistics is used in public health initiatives that benefit the population.
Upon completion of this module, students should be able to:
- Understand and explain the relative strengths and limitations of biostatistics as it applies in various settings in public health
- Be able to detect misleading claims and inappropriate methods in research papers as well as appreciate that a statistically significant result may not be clinically significant
- Appreciate that many interests may influence researchers towards favorable interpretation and presentation of their findings
- Understand that public health programs rely on biostatistics principles and methodologies to collect, analyze, use, and present data
- Relate specific public health contributions to biostatistics concepts learned in this course
-
Learning Objectives

- Understand and explain the relative strengths and limitations of biostatistics as it applies in various settings in public health.
- Be able to detect misleading claims and inappropriate methods in research papers as well as appreciate that a statistically significant result may not be clinically significant.
- Appreciate that many interests may influence researchers towards favorable interpretation and presentation of their findings.
-
Required Learning Resources and Activities
-
Students mustView
- Read the entire article.
- Understand and explain the relative strengths and limitations of biostatistics as it applies in various settings in public health
-
Students mustView
- Scroll down and read sections I to III. The rest of the article is optional reading.
- Be able to detect misleading claims and inappropriate methods in research papers as well as appreciate that a statistically significant result may not be clinically significant
-
Students mustView
- Read the entire article.
- Be able to detect misleading claims and inappropriate methods in research papers as well as appreciate that a statistically significant result may not be clinically significant
-
Students mustView
- Read the entire article.
- Appreciate that many interests may influence researchers towards favourable interpretation and presentation of their findings
-
Students mustViewReceive a grade
To access the quiz, click on the name of the quiz provided above. On the following screen, click the "Preview quiz now" button to view the case studies and respond to the questions.
-
Learning Objectives
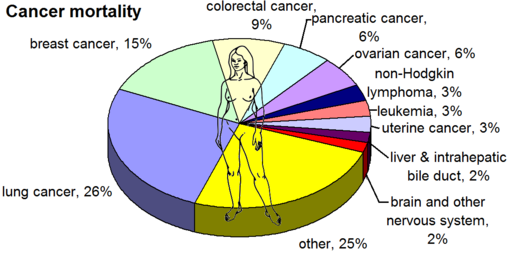
- Understand that public health programs rely on biostatistics principles and methodologies to collect, analyze use, and present data.
- Relate specific public health contributions to biostatistics concepts learned in this course.
-
Required Learning Resources and Activities
-
Students mustView
- Read the entire web page.
- Understand that public health programs rely on biostatistics principles and methodologies to collect, analyze, use, and present data
-
Students mustView
- Scroll down, and under the tab titled "Choose a video:", highlight the link titled "Cancer Statistics". Watch the entire video.
- Understand that public health programs rely on biostatistics principles and methodologies to collect, analyze, use, and present data
-
Students mustView
- Read page 17 of the article.
- Understand that public health programs rely on biostatistics principles and methodologies to collect, analyze, use, and present data
-
-
Students mustView
- Watch the video from 42:50 to 50:05.
- Watch the video from 42:50 to 50:05.
-
Students mustViewReceive a grade
- Find a research article that uses quantitative methodology and answer as many of the following questions as you can in 500 to 1000 words. Most journals and databases have open access content.
- Guidelines for selecting an appropriate article:
- Choose an article from a peer reviewed journal with impact factor of 2.0 or more.
- Choose an article published within the past 5 years.
- Choose an article relevant to the current research and health conditions in a country that is of interest to you.
- An example of an appropriate paper is here. However, you may find that some articles use statistical techniques that you haven’t learned in this course—this is ok. Do your best to understand and describe what the authors have done, and look up any references to methods if needed. The goal of this activity is to (i) help you review the concepts learned and (ii) challenge yourself to learn new methods as they become relevant in your practice. For practising public health professionals, biostatistics is a life-long learning process.
- As you review the paper, focus on the following methods-related questions below:
- What is/are the main relationship being studied? What is the research question? Is there any hypothesis testing involved?
- What are the predictors and outcomes? What type of variables are they?
- How were data obtained for the study? What are the advantages and disadvantages from a statistical perspective?
- Summarize any descriptive techniques in the paper. What summary statistics do the authors use? What data visualization techniques do they use? Are they effective in helping you understand the study?
- What analytic techniques do the authors use? Summarize the main statistical technique used and discuss why the authors chose to use this method. Describe its strengths and limitations in principle and in context, as well as the assumptions and specific parameters used (e.g. significance level, adjustments, etc.).
- Based on your understanding of the research and the results presented, do you agree with the authors’ interpretations? Are there issues present that could bias the authors’ interpretations?
- Relate specific public health contributions to biostatistics concepts learned in this course
-
Students mustViewMake a submission
-
Students mustViewReceive a grade
To access the quiz, click on the name of the quiz provided above. On the following screen, click the "Preview quiz now" button to view the case studies and respond to the questions.
-
Students mustViewComplete the activityReceive a gradeReceive a score of 80 or more
-
Additional Learning Options
-
-
Students mustView
- Explore the links under "Behavioral Health Resources" to become familiar with prevention programs and practices that have been developed based on evidence obtained from research and statistical data:
- Explore the links under "Behavioral Health Resources" to become familiar with prevention programs and practices that have been developed based on evidence obtained from research and statistical data:
-
- Read pages 18 to 21 of the article.
-
-
Final Exam Quiz
To take the final exam, you must complete all quizzes and complete all the required activities. The final exam consists of 65 questions, and you will have 65 minutes to complete it. When the time is over, you will have two minutes to submit your attempt before it expires, and your progress is discarded. You will not be able to answer additional questions in the grace period.
To access the exam, click on the name of the exam provided above. On the following screen, click the "Preview quiz now" button to respond to the questions.
Not available unless any of: You belong to a group in Kirksville College of Osteopathic Medicine ...Not available unless any of:- You belong to a group in Kirksville College of Osteopathic Medicine
- You belong to Miami Med
-
All of:
- The activity Course Registration is marked complete
- The activity Pre-test is marked complete
- The activity Quiz: Module 1: Lesson 1 is marked complete
- The activity Quiz: Module 1: Lesson 2 is marked complete
- The activity Quiz: Module 1: Lesson 3 is marked complete
- The activity Quiz: Module 1: Lesson 4 is marked complete
- The activity Quiz: Module 2: Lesson 1 is marked complete
- The activity Quiz: Module 2: Lesson 2 is marked complete
- The activity Quiz: Module 3: Lesson 1 is marked complete
- The activity Quiz: Module 3: Lesson 2 is marked complete
- The activity Quiz: Module 4: Lesson 1 is marked complete
- The activity Quiz: Module 4: Lesson 2 is marked complete
- The activity Quiz: Module 4: Lesson 3 is marked complete
- The activity Quiz: Module 4: Lesson 4 is marked complete
- The activity Quiz: Module 5: Lesson 1 is marked complete
- The activity Quiz: Module 5: Lesson 2 is marked complete
- The activity Quiz: Module 5: Lesson 3 is marked complete
- The activity Quiz: Module 5: Lesson 4 is marked complete
- The activity Quiz: Module 6: Lesson 1 is marked complete
- The activity Quiz: Module 6: Lesson 2 is marked complete
- The activity Quiz: Module 7: Lesson 1 is marked complete
- The activity Quiz: Module 7: Lesson 2 is marked complete
- You belong to Public Health U
-
-
 In this section, you can provide feedback about this course to help us make NextGenU.org better. Once evaluations are completed, you will be able to download your certificate of completion.
 -
Course Evaluations QuestionnaireNot available unless: The activity Final Exam is marked complete
-
Self Evaluation QuestionnaireNot available unless: The activity Final Exam is marked complete
-
-
-
Students mustMark as done
-
-
 Click here to start Final Examination