Intro to Statistics
You do not have permission to view discussions in this forum.
-
SciencesIntro to StatisticsResume0% complete0% complete
-
Students mustStudent must submit this questionnaire to complete it
-
Students mustViewReceive a grade
Show More-


Welcome to Intro to Statistics, the second course in the Mathematics series for the Health Sciences Training Certificate. This course and the Certificate are designed primarily for learners interested in preparing for and gaining entry to health-related programs and to help address the prerequisites for the Medical College Admission Test (MCAT). This Intro to Statistics course provides in-depth learning about general mathematical concepts and techniques in the natural, physical, behavioral, and social sciences bachelor study. Participants can review and gain mathematical knowledge on analyzing and manipulating scientific data. The course explores important areas of mathematics such as statistics, graphic and numerical methods of describing data, probability, distributions, estimation, testing hypotheses, and regression analysis that can be applied to scientific inquiry.
The International Development Research Centre and the University of the Incarnate Word School of Osteopathic Medicine partly sponsor the Intro to Statistics course. Like all NextGenU.org courses, it is competency-based, using competencies based on the Association of American Medical Colleges' Medical College Admission Test. It uses learning resources from accredited, academic, professional, and world-class organizations and universities such as Rice University. Volunteer designers for this course include Shaunik Sharma, BSc; Tristan Aaron Wild, BMSc (Hons); and the late Mohammad Asadi-Lari, a former MD-PHD Candidate at the University of Toronto. The course was created by Marco Aurelio Hernandez, Ph. D., Alexandria Ali, BSc, and Pablo Baldiviezo, MD. MSc. DiplEd.
For publications on the efficacy of NextGenU.org's courses, see NextGenU.org's publication page.
There are eight modules to complete, which provide an introduction to:
- Module 1: Introduction to Statistics and Research in Health Care.
- Module 2: Graphical Methods of Describing Data.
- Module 3: Numerical Methods of Describing Data: Summary Numbers.
- Module 4: Probability, Random Variables, and Distributions.
- Module 5: Sampling Distributions.
- Module 6: Estimation.
- Module 7: Testing of Hypotheses.
- Module 8: Introduction to Linear Regression Analysis.
The completion time for this course is estimated at 92 hours, 24 comprising hours of learning resources, 48 hours of studying and assimilation of the content, and 20 hours of participating in learning activities and quizzes to assist the learners in synthesizing learning materials. This course is equivalent to 3 credit hours in the U.S. undergraduate/bachelor's degree system.The course requires the completion of all quizzes, discussion forums, and practical activities to receive a course certificate.
Practice quizzes, composed of multiple-choice questions, are available throughout the courses. After you've completed each module, quiz, and learning activity, at the end of the course, you'll have access to a final exam consisting of 25 multiple-choice questions, a last lab activity, and a chance to evaluate this course.
Participants have up to three opportunities to take the final exam and achieve the required passing score of >=70%. Once you've passed the final exam and completed the evaluations, you can download a certificate of completion from NextGenU.org and our course's co-sponsoring organizations.
We keep your personal information confidential, never sell any of your information, and only use anonymized data for research purposes. Also, we are happy to report your testing information and share your work with anyone (your school, employer, etc.) at your request.
Engaging with this Course:
This free course is aimed at students who have graduated from high school and want to prepare to become a health professional and pass the MCAT exam. You can also browse this course for personal enrichment if you don't have any requirements.
To obtain a certificate, a learner must first register for the course and then complete:
- Pre-test
- All the reading requirements,
- All quizzes and pass with 80% with unlimited attempts,
- All practical activities,
- All discussion forums,
- The final lab activity,
- The final exam with a minimum of 80% and a maximum of 3 attempts, and
- The self and course evaluation forms.
To obtain credit:- Complete all requirements listed above for the Certificate, and
- Your learning institution or workplace should approve the partner-university-sponsored NextGenU.org course for educational credit, as they usually would for their learner taking a course anywhere.
NextGenU.org is happy to provide your institution with:- A link to and description of the course training so that they can see all of its components, including the co-sponsoring institutions;
- Your grade on the final exam;
- Your work products (e.g., discussion forum responses) and any other required or optional shared materials that you produce and authorize to share with them;
- Your evaluations -- course and self-assessments;
- A copy of your Certificate of completion with the co-sponsoring organizations listed.
To obtain a degree, NextGenU.org co-sponsors degree programs with institutional partners. To get a whole degree co-sponsored with NextGenU.org, registrants must be enrolled in a degree program as a student of a NextGenU.org institutional partner. If your institution might be interested in offering a degree with NextGenU.org, contact us.
We hope you will find this a rewarding learning experience, and we count on your assessment and feedback to help us improve this training for future students.
Here are the following steps to take the course and earn a certificate:- Complete the registration form.
- Take the pre-test.
- Begin the course with Module 1:Introduction to Statistics and Research in Health Care. In each lesson, read the description, complete all required readings and any required activity, and take the corresponding quizzes.
-
 Competency covered in this module:
 - MCAT: Identify the Role of theory, past findings, and observations in scientific questioning.
- MCAT: Reason about ethical issues in scientific research.
- Miami-Dade: Demonstrate an understanding of descriptive statistics by contrasting between the levels of data.
- MCAT: Distinguish between samples and populations.
- Miami-Dade: Demonstrate an understanding of descriptive statistics by contrasting between the levels of data.
- MCAT: Reason about random and systematic error.
- MCAT: Reason about the appropriateness, precision, and accuracy of tools used to conduct research in the natural sciences.
- MCAT: Reason about the appropriateness, reliability, and validity of tools used to conduct research.
- Miami-Dade: Demonstrate an understanding of descriptive statistics by: designing and formulating sources of decision-making data.
- MCAT: Identify the relationships among the variables in a study (e.g., independent versus dependent variables; control and confounding variables)
- MCAT: Identify testable research questions and hypotheses.
- MCAT: Reason about the features of research studies that suggest associations between variables or causal relationships between them (e.g., temporality, random assignment)
- Miami-Dade: Demonstrate an understanding of descriptive statistics by: designing and formulating sources of decision-making data.
-
Student Learning Outcomes:
Upon completion of this lesson, you will be able to:
- Explain the role of theory, past findings and observations in scientific research.
- Discuss the steps of the scientific method as necessary for scientific research.
- Discuss the role and Identify instances of statistics being used in our daily lives and the in world around us.
- Explain the important role of ethics in research.
-
Required Learning Resources and Activities
-
Students mustView
Read from Pages 3-6: Defining Science to Pages 3-18: Common Sense and Science. (30 minutes)
University of Central Arkansas - 2013
-
Students mustView
Read the entire page. (22 minutes)
US Government; National Institute of Environmental Health Sciences - 2021
-
Students mustViewStart discussions: 1
In this activity, you will discuss the issue of the indispensable use of statistics, despite it being an imperfect science and measure.
Step 1. Review
Review the learning resources for this lesson before answering the question.
Step 2. Analyze
Analyze and discuss the question below.

Step 3. Respond
Respond to the case problem by writing a 300-500-word discussion post with the following inclusions.
Step 4. Share
To share your work, click on the “Add a new discussion topic” button under this post and paste your work in the “Message” box. Make sure to reference others’ intellectual property when necessary. All references should follow 7th Edition APA formatting. For further instructions, see the resource on the Himmelfarb Health Sciences Library: APA citation resource (N.B. references are excluded from word counts).
Step 5: Interact
To complete the activity, you will need to reply to at least two posts made by your peers in a respectful and professional manner. Ensure that your post engages your peers' ideas by including a reflection on their comments, sharing ideas of other potential difficulties and parties involved, or asking thought-provoking questions. If a peer comments on your posting, please reply. To post a reply, click “Reply” on a particular discussion, write your feedback and then click on “Post to the forum.”
OPTIONAL Step 6: Interact (10 minutes)
If you would like to, you can reply to your peers' posts in a respectful and professional manner. Ensure that your post engages your peers' ideas by including a reflection on their comments, sharing ideas of other potential difficulties and parties involved, or asking thought-provoking questions. If a peer comments on your posting, please reply. To post a reply, click “Reply” on a particular discussion, write your feedback and then click on “Post to forum.”
-
Student Learning Outcomes:
Upon completion of this lesson, you will be able to:- Given a research situation, identify and classify the variables and data generated.
- Identify populations, samples, and frames in given statistical studies.
- Classify given measurements according to levels.
- Distinguish between the two categories of measurement error.
- Distinguish between accuracy and precision in measurements.
- Determine the level of accuracy and precision of measurements.
- Explain Validity and Reliability and their importance in research.
- Identify situations of reliability and validity in given measurement.
-
Required Learning Resources and Activities
-
-
Students mustView
Click on and Read the "Types of Data" section. (10 minutes)
Andrews College - 2019
-
Students mustView
Read entire page. (2 minutes)
Penn State Eberly College of Science - 2022
-
Students mustView
Read the Entire Page: Levels of Measurement, and try the set of six questions at the bottom of the page. (10 minutes)
Rice University - 2021
-
Students mustView
Read from beginning up to the end of section titled 'We Can Not Avoid Them'. (6 minutes)
University of Oregon - 2017
-
Students mustView
Read entire page. (6 minutes)
University of Hawaii - 2022
-
Students mustView
Read entire page. (13 minutes)
Washington State University - 2022
-
Quiz: Module1: Lessons 1 & 2
To access the quiz, click on the name of the quiz provided above. On the following screen, click the "Preview quiz now" button to respond to the questions.
TO PASS THIS QUIZ YOU MUST OBTAIN A SCORE OF 80%.
Not available unless: The activity Course Registration is marked complete ...Not available unless:- The activity Course Registration is marked complete
- The activity Pre-Test is marked complete
-
Student Learning Outcomes:
Upon completion of this lesson, you will be able to:- Describe and identify the various sources of data.
- Describe some methods and tools of data collection.
- Identify research variables and Describe the relationship between them.
- Generate testable research questions from an idea.
-
Students mustMark as done
Required Learning Resources and Activities
-
Students mustView
Read entire page. (3 minutes)
Australian Bureau of Statistics - 2022
-
Students mustView
Read entire page. (10 minutes)
Australian Bureau of Statistics - 2022
-
Students mustView
Read Entire page. (10 minutes)
Samarpan Institute of Nursing Sciences - 2013
-
Students mustView
Read entire page and watch included video. (14 minutes)
Research Methods in Psychology - 2015
-
Student Learning Outcomes:
Upon completion of this lesson, you will be able to:
- Discuss the importance of and identify instances of Random Selection and Random Assignment in Research.
-
Determine the sampling method that will best generate samples for a given situation in research.
- Explain the generation of a stratified, a cluster, a systematic, or any other types of sampling discussed in the text.
-
Required Learning Resources and Activities
-
Students mustView
Read entire page. (2 minutes)
San Diego State University - 2021
-
Students mustView
Read entire page. (2 minutes)
San Diego State University - 2021
-
Students mustView
Read up to the end of page 14. (30 minutes)
University of Central Arkansas - 2013
-
Students mustViewStart discussions: 1
Student Learning outcome (Module 1 Lesson 4): Discuss the importance of and identify instances of Random Selection and Random Assignment in Research.
Step 1. Review
Review the learning resources for this lesson before studying the case problem.
Step 2. Analyze
Analyze the case problem below.
A new drug is introduced. How should an experiment be designed to test its effectiveness? The primary method is comparison. The drug is given to subjects in a treatment group, but other subjects are used as controls ‒ they aren’t treated. The treatment and control groups should be as similar as possible ‒ except for the treatment. Then the responses of the two groups are compared. Subjects should be assigned to the groups at random. A randomized controlled assignment is when an impartial chance procedure is used to assign the subjects to treatment or control. This method provides the best assurance of validity and reliability. However, randomized controlled experiments are hard to do. As a result, doctors often use other designs which are not as good. For example, a new treatment can be tried out on one group of patients, who are compared to “historical controls:” patients treated the old way in the past. Usually, using historical controls, assignment to the groups is not randomized, resulting in a poorly-designed experiment. The problem is that the treatment and historical groups may differ in important ways besides the treatment.
Coronary bypass surgery is a widely used ‒ and very expensive ‒ operation for coronary artery disease. Chalmers and associates identified 29 trials of this surgery (first line of the table below). There were 8 randomized controlled trials, and 7 were quite pessimistic about the value of the operation. By comparison, there were 21 trials with historical controls, and 16 were positive. Three other therapies were evaluated: 5-FU, used in chemotherapy for colon cancer; BCG, used to treat melanoma; and DES, used to prevent miscarriage. The data are given below.
Table 1: A study of studies. Four therapies were evaluated by randomized controlled trials and by trials using historical controls. Conclusions of trials are summarized as positive about the value of the therapy (+) or negative (-).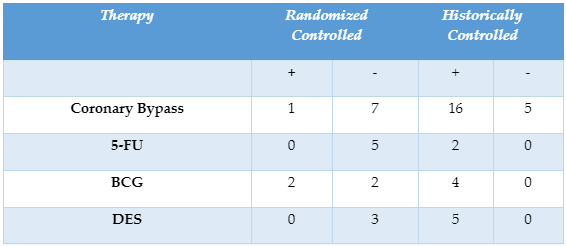
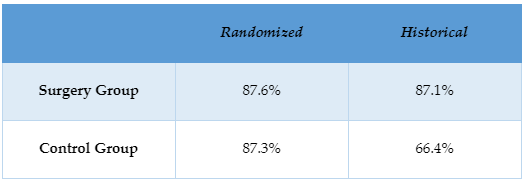
Why are the randomized controlled studies less enthusiastic, and the less well-designed studies more enthusiastic about the value of the surgery?
Look at it in view of the data in the table below.
Table 2: Randomized controlled experiments vs. studies with historical controls: three-year survival rates for surgery patients and patients used as controls in trials of coronary bypass surgery.
Step 3. Respond
Respond to the case problem by answering the question: Why are the randomized controlled studies less enthusiastic and the less well-designed studies more enthusiastic about the value of the surgery?
Step 4. Share
To share your work, access to the first post below and click on the “Reply” button under this post and paste your work into the “Message” box. Make sure to reference others’ intellectual property when necessary. All references should follow 7th Edition APA formatting. For further instructions, see the resource on the Himmelfarb Health Sciences Library: APA citation resource (N.B. references are excluded from word counts).
Step 5: Interact
To complete the activity, you will need to reply to at least two posts by your peers respectfully and professionally. Ensure that your post engages your peers' ideas by including a reflection on their comments, sharing ideas of other potential difficulties and parties involved, or asking thought-provoking questions. If a peer comments on your posting, please reply. To post a reply, click “Reply” on a particular discussion, write your feedback and then click on “post to the forum.”
OPTIONAL Step 6: Interact (10 minutes)
If you would like to, you can reply to your peers' posts in a respectful and professional manner. Ensure that your post engages your peers' ideas by including a reflection on their comments, sharing ideas of other potential difficulties and parties involved, or asking thought-provoking questions. If a peer comments on your posting, please reply. To post a reply, click “Reply” on a particular discussion, write your feedback and then click on “Post to forum.”
-
Students mustViewReceive a gradeReceive a passing grade
To access the quiz, click on the name of the quiz provided above. On the following screen, click the "Preview quiz now" button to respond to the questions.
-
Students mustViewReceive a gradeReceive a passing grade
To access the quiz, click on the name of the quiz provided above. On the following screen, click the "Preview quiz now" button to respond to the questions.
-
 Competency covered in this module:
 - MCAT: Use, analyze, and interpret data n figures, graphs, and tables.
- MCAT: Evaluate whether representations make sense for particular observations and data.
-
Student Learning Outcomes:
Upon completion of this lesson, you will be able to:- Determine the appropriateness of, Create, and Interpret Graphical Representations of Univariate Data with: Pie Charts, Dot Plots, Stem-and-leaf Plots, and Frequency tables.
-
Required Learning Resources and Activities
-
Students mustView
Read entire page. (7 minutes)
Rice University - 2021
-
Students mustView
Watch the entire video. (7 minutes)
Rice University - 2021
-
-
-
Students mustView
Watch entire video. (9 minutes)
Rice University - 2021
-
-
Students mustView
Watch the entire video. (6 minutes)
Rice University - 2021
-
Students mustView
Watch entire video. (23 minutes)
2023
-
Student Learning Outcomes:
Upon completion of this lesson, you will be able to:- Determine the appropriateness of, Create, and Interpret Graphical Representations of Bivariate Data with:: Scatterplots, Line Graphs, and Runs (Time Series) Plots.
-
Students mustMark as done
Required Learning Resources and Activities
-
Students mustView
Read entire page. (6 minutes)
Statistics Canada, Government of Canada - 2021
-
-
Students mustView
Watch entire video. (5 minutes)
Rice University - 2021
-
Students mustView
Read entire page. (4 minutes)
Clinical Excellence Commission, Govt. of Australia - 2022
-
-
Student Learning Outcomes:
Upon completion of this lesson, you will be able to:- Determine whether graphical representations of statistical analysis results are clearly communicated.
- Read and Interpret Statistical Graphs
-
Students mustMark as done
Required Learning Resources and Activities
-
Students mustView
Read Up to and including Page 19. (20 minutes)
State of Washington Government - 2017
-
Students mustView
Read entire page. (13 minutes)
Vanderbilt University, Dept of Biostatistics - 2021
-
Students mustViewStart discussions: 1
In this activity, you will discuss the interpretation of statistical graphs and the relationship between variables.
Step 1. Review
Review the learning resources for this lesson before answering the question.
Step 2. Analyze
Analyze and discuss the question below.
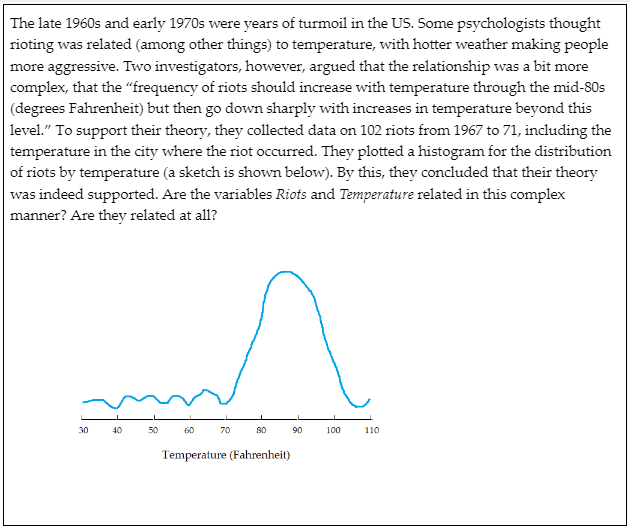
Step 3. Respond
Respond to the case problem by writing a 300-500-word discussion post with the following inclusions.
Step 4. Share
To share your work, click on the “Add a new discussion topic” button under this post and paste your work in the “Message” box. Make sure to reference others’ intellectual property when necessary. All references should follow 7th Edition APA formatting. For further instructions, see the resource on the Himmelfarb Health Sciences Library: APA citation resource (N.B. references are excluded from word counts).
Step 5: Interact
To complete the activity, you will need to reply to at least two posts by your peers respectfully and professionally. Ensure that your post engages your peers' ideas by including a reflection on their comments, sharing ideas of other potential difficulties and parties involved, or asking thought-provoking questions. If a peer comments on your posting, please reply. To post a reply, click “Reply” on a particular discussion, write your feedback and then click on “Post to the forum.”
OPTIONAL Step 6: Interact (10 minutes)
If you would like to, you can reply to your peers' posts in a respectful and professional manner. Ensure that your post engages your peers' ideas by including a reflection on their comments, sharing ideas of other potential difficulties and parties involved, or asking thought-provoking questions. If a peer comments on your posting, please reply. To post a reply, click “Reply” on a particular discussion, write your feedback and then click on “Post to forum.”
-
Quiz: Module 2
To access the quiz, click on the name of the quiz provided above. On the following screen, click the attempt quiz button to view the case studies and respond to the questions.
TO PASS THIS QUIZ YOU MUST OBTAIN A SCORE OF 80%.
Not available unless: The activity Quiz: Module 1 is marked complete
-
 Competency covered in this module:
 - MCAT: Use measures of Central Tendency and Measures of Dispersion to describe data.
- MCAT: Demonstrate an understanding of managing data by: evaluating and analyzing methods for examining central tendency; Formulating various techniques to analyze data dispersion; Assessing use of fractile measures such as quartiles and percentiles.
- MCAT: Use, analyze, and interpret data n figures, graphs, and tables.
- Miami-Dade: Demonstrate an understanding of descriptive statistics by: Interpreting and assessing data displayed using visual graphic presentation methods.
- MCAT: Reason about ethical issues in scientific research.
-
Student Learning Outcomes:
Upon completion of this lesson, you will be able to:- Explain the concept of central tendency.
- Compute the midrange, midquartile, mean, median, mode, weighted, or combined mean of a given data set.
- Explain the weakness of the median and mean as measures of CT.
- Determine whether it is appropriate to use the mean, the median, and the mode to express the center of a given dataset.
-
Required Learning Resources and Activities
-
Students mustView
Read entire page. (12 minutes)
Rice University - 2021
-
Students mustView
Watch the entire video. (11 minutes)
Rice University - 2021
-
Students mustView
Read entire page and do the set of five (5) questions at the bottom of the page. (10 minutes)
Rice University - 2021
-
Students mustView
Watch the entire video. (21 minutes)
2023
-
Students mustView
Read entire page. (3 minutes)
Michigan State University - 2016
-
Student Learning Outcomes:
Upon completion of this lesson, you will be able to:- Explain dispersion in distributions.
- Compute the range, interquartile range, variance, and standard deviation of a given data distribution.
-
Students mustMark as done
Required Learning Resources and Activities
-
-
Students mustView
Watch entire video. (7 minutes)
Rice University - 2021
-
-
Student Learning Outcomes:
Upon completion of this lesson, you will be able to:- Find percentile and quartiles of a distribution.
- Explain the purpose of and compute the z-score of a measure within a distribution.
- Normalize scores from different distributions to compare them.
-
Students mustMark as done
Required Learning Resources and Activities
-
Students mustView
Read entire page. (7 minutes)
Penn State University, Eberly College of Science - 2022
-
Students mustView
Watch all slides. (20 minutes)
Cal State University, Northridge - 2021
-
Students mustView
Read entire page. (6 minutes)
University of Texas at Dallas - 2022
-
Quiz: Module 3: Lessons 1, 2 & 3
To access the quiz, click on the name of the quiz provided above. On the following screen, click the "Preview quiz now" button to respond to the questions.
TO PASS THIS QUIZ YOU MUST OBTAIN A SCORE OF 80%.
Not available unless: The activity Quiz: Module 2 is marked complete
-
Student Learning Outcomes:
Upon completion of this lesson, you will be able to:- Define basic terms including hinges (fences), H-spread, step, adjacent value, outside value (outlier), and far out value (far outlier).
- Use the 5-number summary to create boxplots to describe a dataset.
- Create and interpret side-by-side box (parallel) plots to compare two variables.
- Create an adjusted boxplot to identify outliers.
- Create an Adjusted Box Plot.
- Find Grouped Mean and Variance.
Click here to start this lesson-
Required Learning Resources and Activities
-
Students mustView
Read entire Page and answer questions at the bottom of the page. (11 minutes)
Rice University - 2021
-
Students mustView
Watch entire video. (8 minutes)
Rice University - 2021
-
Students mustView
Watch entire video. (18 minutes)
-
Students mustViewStart discussions: 1
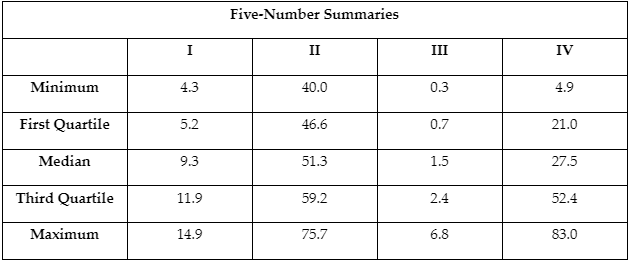
Student Learning outcome: Use the Five-Number Summary to Create a Boxplot to Describe a Data Set
In this activity, you will investigate the relationship between boxplot shapes and the corresponding five-number summary.Step 1. Review
Review the learning resources for this lesson before studying the case problem.
Step 2. Analyze
Analyze the case problem below.
The accompanying figure shows four boxplots labeled A to D. Also given are four five-number summaries, labeled I to IV. Match each five-number summary to the appropriate boxplot. Note that scales are not included on the boxplots, so you will have to consider what the five-number summary implies about the characteristics of the boxplot.
Step 3. Respond
Respond to the case problem by showing the boxplot properties, logic steps, and reasoning you used to match each figure with its corresponding five-number summary.
Step 4. Share
To share your work, access to the first post below and click on the “Reply” button under this post and paste your work into the “Message” box. Make sure to reference others’ intellectual property when necessary. All references should follow 7th Edition APA formatting. For further instructions, see the resource on the Himmelfarb Health Sciences Library: APA citation resource (N.B. references are excluded from word counts).
Step 5: Interact
To complete the activity, you will need to reply to at least two posts by your peers respectfully and professionally. Ensure that your post engages your peers' ideas by including a reflection on their comments, sharing ideas of other potential difficulties and parties involved, or asking thought-provoking questions. If a peer comments on your posting, please reply. To post a reply, click “Reply” on a particular discussion, write your feedback and then click on “post to the forum.”
OPTIONAL Step 6: Interact (10 minutes)
If you would like to, you can reply to your peers' posts in a respectful and professional manner. Ensure that your post engages your peers' ideas by including a reflection on their comments, sharing ideas of other potential difficulties and parties involved, or asking thought-provoking questions. If a peer comments on your posting, please reply. To post a reply, click “Reply” on a particular discussion, write your feedback and then click on “Post to forum.”
-
Student Learning Outcomes:
Upon completion of this lesson, you will be able to:- Distinguish between parameters and statistics.
- Explain and give examples of skew and kurtosis of a distribution.
- Identify and compare the relative positions of the mean and median and the difference between them as they are affected by skew.
- Illustrate some ways in which graphs and statistics can be used to mislead.
- Graph mixed bivariate data sets-
- interpret graphs for Time Series Data.
- Use numerical summaries with control charts to determine when a system is out-of-control.
-
Students mustMark as done
Required Learning Resources and Activities
-
Students mustView
Read the page to the end of 'Samples and Statistics' section. (5 minutes)
Penn State University - 2022
-
Students mustView
Read entire page, paying more attention to the concepts than to the formulas. (8 minutes)
Mustansiriyah University - 2021
-
Students mustView
Read entire page. (7 minutes)
UC Davis - 2022
-
Students mustView
Read entire page. (10 minutes)
Arkansas Tech University - 2021
-
-
Students mustView
Read entire page. (8 minutes)
(ASQ) American Society for Quality - 2022
-
Students mustViewStart discussions: 1
In this activity, you will discuss factors of data collection that affect the shape, particularly the skewness, of the data distribution.
Step 1. Review
Review the learning resources for this lesson before answering the question.
Step 2. Analyze
Analyze and discuss the question below.
 Step 3. Respond
Respond to the case problem by writing a 300-500-word discussion post with the following inclusions.
Step 4. Share
To share your work, click on the “Add a new discussion topic” button under this post and paste your work into the “Message” box. Make sure to reference others’ intellectual property when necessary. All references should follow 7th Edition APA formatting. For further instructions, see the resource on the Himmelfarb Health Sciences Library: APA citation resource (N.B. references are excluded from word counts).
Step 5: Interact
To complete the activity, you will need to reply to at least two posts made by your peers respectfully and professionally. Ensure that your post engages your peers' ideas by including a reflection on their comments, sharing ideas of other potential difficulties and parties involved, or asking thought-provoking questions. If a peer comments on your posting, please reply. To post a reply, click “Reply” on a particular discussion, write your feedback and then click on “Post to the forum.”
OPTIONAL Step 6: Interact (10 minutes)
If you would like to, you can reply to your peers' posts in a respectful and professional manner. Ensure that your post engages your peers' ideas by including a reflection on their comments, sharing ideas of other potential difficulties and parties involved, or asking thought-provoking questions. If a peer comments on your posting, please reply. To post a reply, click “Reply” on a particular discussion, write your feedback and then click on “Post to forum.”
-
Quiz: Module 3: Lessons 4 & 5
To access the quiz, click on the name of the quiz provided above. On the following screen, click the attempt quiz button to view the case studies and respond to the questions.
TO PASS THIS QUIZ YOU MUST OBTAIN A SCORE OF 80%.
Not available unless: The activity Quiz: Module 3: Lessons 1, 2 & 3 is marked complete -
Students mustViewReceive a gradeReceive a passing grade
To access the quiz, click on the name of the quiz provided above. On the following screen, click the "Preview quiz now" button to respond to the questions.
-
 Competency covered in this module:
 Miami-Dade: Compute basic probabilities as used in statistical applications by comparing the concepts of probability; demonstrating the elementary rules of probability; creating used for Bayes' Theorem, and differing among the counting rules. - Yale: random Variables, discrete, continuous, density functions. Mean and Variance of random variables, definitions, and properties.
-
Student Learning Outcomes:
Upon completion of this lesson, you will be able to:- Determine the permutations and combinations of n items arranged r at a time.
-
Students mustMark as done
Required Learning Resources and Activities
-
Students mustView
Read entire page. (25 minutes)
Dux College, Australia - 2022
-
Student Learning Outcomes:
Upon completion of this lesson, you will be able to:- Explain the meaning of the probability of an event A in a sample space S.
- Calculate the probability of a specified simple event in a chance experiment with equally likely outcomes determine simple probabilities using the complement rule, and frequencies or count.
- Determine compound probabilities using the addition rules for disjoint and non-disjoint events.
- Find the conditional probabilities of events.
- determine if two given events are independent.
- Find probabilities using the multiplication rule.
- Find probabilities using Bayes' Rule.
- Determine Sensitivity, Specificity, False Negative, and False Positive probabilities, the Prevalence of a disease, the Predictive Value Positive, and Predictive Value Negative of a Screening Test from a contingency table.
-
Required Learning Resources and Activities
-
Students mustView
Read entire page. (4 minutes)
Institute for Work and Health - 2010
-
Students mustView
Read entire page and watch the video included. (25 minutes)
University of Florida - 2022
-
-
Students mustView
Watch entire video. (5 minutes)
Khan Academy - 2022
-
Students mustView
Read entire page. (25 minutes)
University of Florida - 2022
-
Students mustView
Read entire page. (32 minutes)
NIH - National Library of Medicine - 2021
-
Students mustView
Read entire page. (10 minutes)
Boston University School of Public Health - 2021
-
-
Students mustViewStart discussions: 1
Student Learning Outcome (Module 4 Lesson 2): Determine Sensitivity, Specificity, False Negative, and False Positive probabilities, the Prevalence of a disease, the Predictive Value Positive, and Predictive Value Negative of a Screening Test from a contingency table.
Step 1. Review
Review the learning resources for this lesson before studying the case problem.
Step 2. Analyze
Analyze the case problem below.
The paper “Good for Men, Good for Women, bad for People: Simpson’s Paradox and the Important of Sec-Specific Analysis in Observational Studies” (Journal of Women’s Health and Gender-Based Medicine [2001]: 867-872) described a medical study in which one treatment was shown to be better for men and better for women than a competing treatment when the data for men and women were analyzed separately. However, if the data for men and women are combined, it appears as though the competing treatment is better.
To see how this can happen, consider the accompanying data tables constructed from the information in the paper. Subjects in the study were given either Treatment A or Treatment B, and survival was noted. Let S be the event that a patient selected at random survives, A be the event that a patient selected at random received Treatment A, and B be the event that a patient selected at random received Treatment B.
The following table summarizes data for the men who participated in the study:
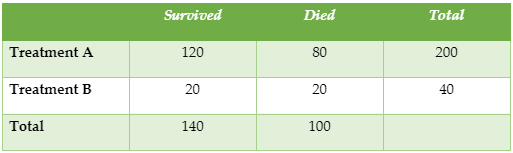
1. Find PS.
2. Find PS|A.
3. Find PS|B.
4. Which treatment appears to be better?Now consider the summary data for women who participated in the study:
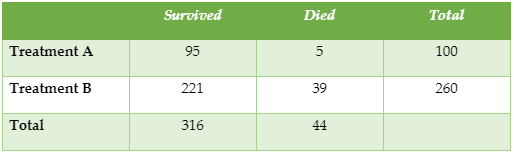
5. Find PS.
6. Find PS|A.
7. Find PS|B.
8. Which treatment appears to be better?Now consider the data summary for men and women combined:
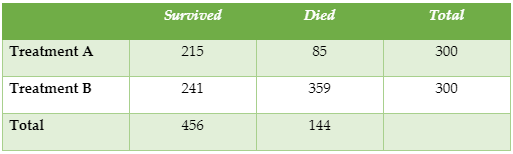
This is an example of what is called Simpson’s paradox.9. Find PS.
10. Find PS|A.
11. Find PS|B.
12. Which treatment appears to be better?Step 3. Respond
Respond to the case problem by writing a brief explanation of why this apparent inconsistency occurs for this data set.
Step 4. Share
To share your work, access to the first post below and click on the “Reply” button under this post and paste your work into the “Message” box. Make sure to reference others’ intellectual property when necessary. All references should follow 7th Edition APA formatting. For further instructions, see the resource on the Himmelfarb Health Sciences Library: APA citation resource (N.B. references are excluded from word counts).
Step 5: Interact
To complete the activity, you will need to reply to at least two posts by your peers respectfully and professionally. Ensure that your post engages your peers' ideas by including a reflection on their comments, sharing ideas of other potential difficulties and parties involved, or asking thought-provoking questions. If a peer comments on your posting, please reply. To post a reply, click “Reply” on a particular discussion, write your feedback and then click on “post to the forum.”
OPTIONAL Step 6: Interact (10 minutes)
If you would like to, you can reply to your peers' posts in a respectful and professional manner. Ensure that your post engages your peers' ideas by including a reflection on their comments, sharing ideas of other potential difficulties and parties involved, or asking thought-provoking questions. If a peer comments on your posting, please reply. To post a reply, click “Reply” on a particular discussion, write your feedback and then click on “Post to forum.”
-
Student Learning Outcomes:
Upon completion of this lesson, you will be able to:- Explain the concept of a random variable.
- Distinguish between discrete and continuous random variables.
- Given the experiment, and the random variable defined, create the frequency, probability, and cumulative distributions, and their attendant graphs.
- Answer probability questions based on the distributions created from the random variable
-
Students mustMark as done
Required Learning Resources and Activities
-
Students mustView
Read the entire page and watch the included video. (17 minutes)
University of Florida - 2022
-
-
Quiz: Module 4: Lessons 1, 2 & 3
To access the quiz, click on the name of the quiz provided above. On the following screen, click the attempt quiz button to view the case studies and respond to the questions.
TO PASS THIS QUIZ YOU MUST OBTAIN A SCORE OF 80%.
Not available unless: The activity Quiz: Module 3: Lessons 4 & 5 is marked complete
-
Student Learning Outcomes:
Upon completion of this lesson, you will be able to:- Find the expected value (mean), variance, and standard deviation of a discrete random variable.
- Identify a situation in which a binomial random variable can be used to model and predict.
- Compute and interpret the mean and standard deviation of a binomial random variable.
- Calculate probabilities using the binomial distribution.
- Identify a situation in which a Poisson random variable can be used to model and predict.
- Calculate probabilities using the Poisson distribution.
-
Students mustMark as done
Required Learning Resources and Activities
-
Students mustView
Read the entire page and watch the included video. (26 minutes)
University of Florida - 2022
-
Students mustView
Read the entire page and watch the included video. (22 minutes)
-
Students mustView
Read the entire page and watch the two short videos included. (15 minutes)
Penn State University - 2021
-
Students mustView
Read the entire page and watch the two short videos included. (13 minutes)
-
Student Learning Outcomes:
Upon completion of this lesson, you will be able to:- Interpret the mean, standard deviation, and shape of probability distributions of continuous random variables.
- Explain the key features of the normal distribution.
- Calculate probabilities of a non-standard normal distribution using the standard normal distribution tables.
- Use the Empirical Rule to compute percentages under the curve of the normal distribution.
- Standard Normal Distribution Tables.
-
Required Learning Resources and Activities
-
Students mustMark as done
Read the entire page and watch the included video. (17 minutes)
Florida State University - 2022
-
Students mustMark as done
Read the entire page and watch the included video. (20 minutes)
Florida State University - 2022
-
Students mustView
Read the entire page and watch the included video. (24 minutes)
Florida State University - 2022
-
Students mustViewStart discussions: 1
In this activity, you will discuss some of the key features and properties of the normal distribution.
Step 1. Review
Review the learning resources for this lesson before answering the question.
Step 2. Analyze
Analyze and discuss the question below.

Step 3. Respond
Respond to the case problem by writing a 300-500-word discussion post with the following inclusions.
Step 4. Share
To share your work, click on the “Add a new discussion topic” button under this post and paste your work in the “Message” box. Make sure to reference others’ intellectual property when necessary. All references should follow 7th Edition APA formatting. For further instructions, see the resource on the Himmelfarb Health Sciences Library: APA citation resource (N.B. references are excluded from word counts).
Step 5: Interact
To complete the activity, you will need to reply to at least two posts made by your peers respectfully and professionally. Ensure that your post engages your peers' ideas by including a reflection on their comments, sharing ideas of other potential difficulties and parties involved, or asking thought-provoking questions. If a peer comments on your posting, please reply. To post a reply, click “Reply” on a particular discussion, write your feedback and then click on “Post to the forum.”
OPTIONAL Step 6: Interact (10 minutes)
If you would like to, you can reply to your peers' posts in a respectful and professional manner. Ensure that your post engages your peers' ideas by including a reflection on their comments, sharing ideas of other potential difficulties and parties involved, or asking thought-provoking questions. If a peer comments on your posting, please reply. To post a reply, click “Reply” on a particular discussion, write your feedback and then click on “Post to forum.”
-
Quiz: Module 4: Lessons 4 & 5
To access the quiz, click on the name of the quiz provided above. On the following screen, click the attempt quiz button to view the case studies and respond to the questions.
TO PASS THIS QUIZ YOU MUST OBTAIN A SCORE OF 80%.
Not available unless: The activity Quiz: Module 4 is marked complete -
Quiz: Module 4
To access the quiz, click on the name of the quiz provided above. On the following screen, click the "Preview quiz now" button to respond to the questions.
TO PASS THIS QUIZ YOU MUST OBTAIN A SCORE OF 80%.
Not available unless: The activity Quiz: Module 3 is marked complete
-
 Competency covered in this module:
 MCAT: Reason about statistical significance and uncertainty (e.g., interpreting statistical significance leve and confidence intervals.
-
Student Learning Outcomes:
Upon completion of this lesson, you will be able to:- Discuss the concept of variability of the sample statistics, and the connection between variability, the population parameter, and sample size.
-
Students mustMark as done
Required Learning Resources and Activities
-
Students mustView
Read entire Page and watch included video. (16 minutes)
University of Bristol - 2021
-
Student Learning Outcomes:
Upon completion of this lesson, you will be able to:- Explain the concept of a sampling distribution.
- Distinguish between the Sampling Distribution of the Mean, a distribution of the sample, and the population distribution.
-
Students mustMark as done
Required Learning Resources and Activities
-
Students mustView
Watch entire Video. (10 minutes)
Khan Academy - 2022
-
Student Learning Outcomes:
Upon completion of this lesson, you will be able to:- Explain the Central Limit Theorem (CLT) and its importance in Inferential Statistics.
-
Find and apply the mean and standard error of the sampling distribution of the mean, as summarized by the CLT.
-
Required Learning Resources and Activities
-
Students mustView
Watch entire Video. (10 minutes)
Khan Academy - 2022
-
Students mustView
Read entire page. (20 minutes)
Florida state University - 2022
-
Students mustViewStart discussions: 1
Student Learning Outcome (Module 5 Lesson 3): Find and apply the mean and standard error of the sampling distribution of the mean, as summarized by the Central Limit Theorem.
Step 1. Review
Review the learning resources for this lesson before studying the case problem.
Step 2. Analyze
Analyze the case problem below.
Part 1:
Use the set of numbers {10, 20, 30, 40, 50} to perform he following tasks:
1. Make a list of all possible samples of size 2 that could be drawn with replacement from this set of numbers, for example, (20, 30), (10, 50), (40, 40).2. Find all the sample means and construct the sampling distribution of sample means in tabular form, an example of which is shown below.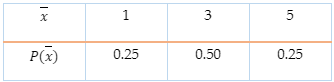
3. Find all the sample ranges and construct the sampling distribution of sample ranges in tabular form, an example of which is shown below.
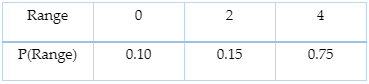
Part 2:
4. Using the Central Limit Theorem, calculate the mean and standard error of the sampling distribution of sample means.
Step 3. Respond
Respond to the case problem by writing answers to Questions 1, 2, 3, and 4.
Step 4. Share
To share your work, access to the first post below and click on the “Reply” button under this post and paste your work into the “Message” box. Make sure to reference others’ intellectual property when necessary. All references should follow 7th Edition APA formatting. For further instructions, see the resource on the Himmelfarb Health Sciences Library: APA citation resource (N.B. references are excluded from word counts).
Step 5: Interact
To complete the activity, you will need to reply to at least two posts by your peers respectfully and professionally. Ensure that your post engages your peers' ideas by including a reflection on their comments, sharing ideas of other potential difficulties and parties involved, or asking thought-provoking questions. If a peer comments on your posting, please reply. To post a reply, click “Reply” on a particular discussion, write your feedback and then click on “post to the forum.”
OPTIONAL Step 6: Interact (10 minutes)
If you would like to, you can reply to your peers' posts in a respectful and professional manner. Ensure that your post engages your peers' ideas by including a reflection on their comments, sharing ideas of other potential difficulties and parties involved, or asking thought-provoking questions. If a peer comments on your posting, please reply. To post a reply, click “Reply” on a particular discussion, write your feedback and then click on “Post to forum.”
-
Quiz: Module 5
To access the quiz, click on the name of the quiz provided above. On the following screen, click the attempt quiz button to respond to the questions.
TO PASS THIS QUIZ YOU MUST OBTAIN A SCORE OF 80%.
Not available unless: The activity Quiz: Module 4 is marked complete
-
 Competency covered in this module:
 - MCAT: Relating statistical significance and uncertainty to conclusions that can or cannot be made about the study.
- MCAT: Using data to explain relationships between variables.
-
Student Learning Outcomes:
Upon completion of this lesson, you will be able to:- Explain why we need to estimate.
-
Distinguish between point and interval estimates.
- Explain what a margin of error is.
- Find the margin of error given the confidence interval limits.
- Explain what a confidence interval is.
-
Required Learning Resources and Activities
-
Students mustView
Read entire page: Confidence Intervals Introduction and watch accompanying video. (24 minutes)
Rice University - 2021
- Explain why we need to estimate.
-
Student Learning Outcomes:
Upon completion of this lesson, you will be able to:- Compute and interpret a confidence interval on the mean when σ is known.
-
t-Distribution Tables.
- Determine whether to use a t-distribution or a normal distribution to compute confidence intervals.
- Compute a confidence interval on the mean when σ is estimated.
- Compute and interpret confidence intervals for proportions.
-
Required Learning Resources and Activities
-
Students mustView
Read entire page and watch accompanying video: Confidence Interval on the Mean. (18 minutes)
2021
-
Students mustView
Read entire page: Confidence Intervals for Proportions and watch accompanying video. (11 minutes)
-
Students mustViewStart discussions: 1
Student Learning Outcome (Module 6 Lesson 2): Compute and interpret confidence intervals for proportions.
Step 1. Review
Review the learning resources for this lesson before studying the case problem.
Step 2. Analyze
Analyze the case problem below.
The article “Doctors Cite Burnout in Mistakes” (San Luis Obispo Tribune, March 5, 2002) reported that many doctors completing their residency have financial struggles that could interfere with training. In a sample of 115 residents, 38 reported working moonlighting jobs, and 22 reported high credit card debt. Suppose that it is reasonable to consider this sample of 115 a random sample of all medical residents in the United States.
-
Construct and interpret a 95% confidence interval for the proportion of U.S. medical residents who work moonlighting jobs.
-
Construct and interpret a 90% confidence interval for the proportion of U.S. medical residents who report high credit card debt.
-
Give two reasons why the confidence interval in Part 1 is wider than in Part 2.
-
Consider the following statement: If the process of selecting a sample of size 115 and then computing the corresponding confidence interval is repeated 100 times, 95% of the resulting intervals will include the true population proportion. Is this statement correct? Why or why not?
Step 3. Respond
Respond to the case problem by writing answers to Parts 3 and 4.
Step 4. Share
To share your work, access to the first post below and click on the “Reply” button under this post and paste your work into the “Message” box. Make sure to reference others’ intellectual property when necessary. All references should follow 7th Edition APA formatting. For further instructions, see the resource on the Himmelfarb Health Sciences Library: APA citation resource (N.B. references are excluded from word counts).
Step 5: Interact
To complete the activity, you will need to reply to at least two posts by your peers respectfully and professionally. Ensure that your post engages your peers' ideas by including a reflection on their comments, sharing ideas of other potential difficulties and parties involved, or asking thought-provoking questions. If a peer comments on your posting, please reply. To post a reply, click “Reply” on a particular discussion, write your feedback and then click on “post to the forum.”
OPTIONAL Step 6: Interact (10 minutes)
If you would like to, you can reply to your peers' posts in a respectful and professional manner. Ensure that your post engages your peers' ideas by including a reflection on their comments, sharing ideas of other potential difficulties and parties involved, or asking thought-provoking questions. If a peer comments on your posting, please reply. To post a reply, click “Reply” on a particular discussion, write your feedback and then click on “Post to forum.”
-
- Compute and interpret a confidence interval on the mean when σ is known.
-
Student Learning Outcomes:
Upon completion of this lesson, you will be able to:- Find and Interpret the Confidence Interval for the Difference in Means of Two Independent Samples.
-
Find and Interpret the Confidence Interval for the Difference in Two Proportions.
-
Required Learning Resources and Activities
-
Students mustView
Read entire Page. (20 minutes)
Bistibn University School of Public Health - 2021
-
Students mustMark as done
(13 minutes)
Bistibn University School of Public Health - 2021
-
Quiz: Module 6
To access the quiz, click on the name of the quiz provided above. On the following screen, click the attempt quiz button to respond to the questions.
TO PASS THIS QUIZ YOU MUST OBTAIN A SCORE OF 80%.
Not available unless: The activity Quiz: Module 5 is marked complete
- Find and Interpret the Confidence Interval for the Difference in Means of Two Independent Samples.
-
 Competency covered in this module:
 - MCAT: Use data to answer research questions and draw conclusions.
- MCAT: Identify testable research questions and hypotheses.
- MCAT: Identify conclusions that are supported by research results and determine the implications of results for real-world situations.
- MCAT: Distinguish between results that do and do not support generalizations about populations.
-
Student Learning Outcomes:
Upon completion of this lesson, you will be able to:- Explain the meaning of the term "statistically significant."
- Determine the null and alternative hypotheses from a description of an experiment.
-
Describe how a p-value is used to cast doubt on the null hypothesis.
- Differentiate between Type I and Type II errors.
- State the null hypothesis for both one-tailed and two-tailed tests for a given Hypothesis test.
-
Required Learning Resources and Activities
-
Students mustView
Read entire page: Introduction to Hypothesis Testing. (8 minutes)
Rice University - 2021
-
Students mustView
Watch the video: Introduction to Hypothesis Testing. (11 minutes)
Rice University - 2021
-
Students mustView
Read entire page - Section 8.1: Elements of Hypothesis Testing. (15 minutes)
LibreTexts - UC Davis - 2022
-
Students mustView
Read entire page: Significance Testing. (6 minutes)
Rice University - 2021
-
Students mustView
Watch video: Significance Testing. (6 minutes)
Rice University - 2021
-
Students mustView
Read entire page: Type I and Type II Errors. (5 minutes)
Rice University - 2021
-
Students mustView
Watch video: Type I and Type II Errors. (8 minutes)
Rice University - 2021
-
Students mustView
Read entire page: One- and Two-Tailed Tests. (5 minutes)
Rice University - 2021
-
Students mustView
Watch the video: One- and Two-Tailed Tests. (6 minutes)
Rice University - 2021
- Explain the meaning of the term "statistically significant."
-
Student Learning Outcomes:
Upon completion of this lesson, you will be able to:- Perform one- and two-tailed hypothesis tests for the mean in the case when is known (or for a large sample), using the steps involved in significance testing.
-
Perform one- and two-tailed hypothesis tests for the mean in the case when has to be estimated (of for a small sample), using the steps involved in significance testing.
- Use the steps involved in significance testing to perform one- and two-tailed hypotheses tests for the single proportion.
-
Required Learning Resources and Activities
-
Students mustView
Read entire Page - Section 8.2: Largel Sample Test for the Mean. (20 minutes)
LibreBooks -UC Davis - 2022
-
Students mustView
Read Entire Page - Section 8.4: Small Sample Test for the Mean. (20 minutes)
LibreBooks -UC Davis - 2022
-
Students mustView
Read entire page - Section 8.5: Large Sample Test for the Population Proportion. (25 minutes)
LibreBooks -UC Davis - 2022
-
Quiz: Module 7: Lessons 1 & 2
To access the quiz, click on the name of the quiz provided above. On the following screen, click the attempt quiz button to respond to the questions.
TO PASS THIS QUIZ YOU MUST OBTAIN A SCORE OF 80%.
Not available unless: The activity Quiz: Module 6 is marked complete
- Perform one- and two-tailed hypothesis tests for the mean in the case when is known (or for a large sample), using the steps involved in significance testing.
-
Student Learning Outcomes:
Upon completion of this lesson, you will be able to:- Explain the steps involved in significance testing for the difference in the means of two independent samples.
-
Explain the steps involved in significance testing for the difference in the means of paired samples.
- Explain the steps involved in significance testing for the difference in two proportions.
-
Required Learning Resources and Activities
-
Students mustView
Read entire page - Section 9.1: Comparison of Two Population Means - Large, Independent samples. (20 minutes)
LibreBooks -UC Davis - 2022
-
Students mustView
Read entire page - Section 9.3: Comparison of two population means, Paired Samples. (25 minutes)
LibreBooks -UC Davis - 2022
-
Students mustView
Read entire page - Section 9.4: Comparison of Two Population Proportions. (20 minutes)
LibreBooks -UC Davis - 2022
- Explain the steps involved in significance testing for the difference in the means of two independent samples.
-
Student Learning Outcomes:
Upon completion of this lesson, you will be able to:- Describe the Chi-Square distribution.
-
Perform and interpret a Chi-Square test for Independence.
- Perform and interpret a Chi-Square Goodness-of-Fit test.
-
Required Learning Resources and Activities
-
Students mustView
Read entire page: The Chi-Square Distribution. (5 minutes)
Rice University - 2021
-
Students mustView
Watch the video: Chi-Square Distribution. (3 minutes)
Rice University - 2021
-
Students mustView
Read entire page: Section - 11.3: Chi Square Test for Independence. (6 minutes)
Eberly College of Science, Penn State University - 2022
-
Students mustView
Read entire page: Worked example. (8 minutes)
Eberly College of Science, Penn State University - 2022
-
Students mustView
Watch the entire lecture video. (27 minutes)
-
Students mustView
Read entire page: Section - 11.2: Chi Square Goodness-of-Fit Test. (7 minutes)
Eberly College of Science, Penn State University - 2022
-
Students mustView
Read entire page - Section 11.2.1 -Five-Step Procedure. (7 minutes)
Eberly College of Science, Penn State University - 2022
-
Students mustView
Watch video. (7 minutes)
Eberly College of Science, Penn State University - 2022
-
Students mustView
Read entire page. (9 minutes)
Eberly College of Science, Penn State University - 2022
-
Students mustViewStart discussions: 1
Student Learning Outcome (Module 7 Lesson 4): Perform and interpret a Chi-Square Test for Independence.
Step 1. Review
Review the learning resources for this lesson before studying the case problem.
Step 2. Analyze
Analyze the case problem below.
The following table is based on data from 21,870 physicians aged 40 – 84 who are participating in the Physicians Health Study (“Light-to-Moderate Alcohol Consumption and Risk of Stroke Among US Physicians,” New England Journal of Medicine [2019]: 1557 - 1564):
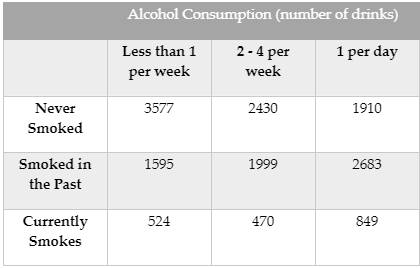
Calculate row proportions by dividing each observed count by the corresponding row total. Are the proportions falling in each of the alcohol consumption categories similar for the three smoking categories?
Test the hypothesis using 𝛼 = 0.05 that Smoking Status and Alcohol Consumption are independent.
Is your test result in Part 2 consistent with what you expected based on your answer to Part 1? If not, explain why your initial impression based on the proportions may not have been accurate.
Step 3. Respond
Respond to the case problem by writing answers to Parts 1, 2, and 3.
Step 4. Share
To share your work, access to the first post below and click on the “Reply” button under this post and paste your work into the “Message” box. Make sure to reference others’ intellectual property when necessary. All references should follow 7th Edition APA formatting. For further instructions, see the resource on the Himmelfarb Health Sciences Library: APA citation resource (N.B. references are excluded from word counts).
Step 5: Interact
To complete the activity, you will need to reply to at least two posts by your peers respectfully and professionally. Ensure that your post engages your peers' ideas by including a reflection on their comments, sharing ideas of other potential difficulties and parties involved, or asking thought-provoking questions. If a peer comments on your posting, please reply. To post a reply, click “Reply” on a particular discussion, write your feedback and then click on “post to the forum.”
OPTIONAL Step 6: Interact (10 minutes)
If you would like to, you can reply to your peers' posts in a respectful and professional manner. Ensure that your post engages your peers' ideas by including a reflection on their comments, sharing ideas of other potential difficulties and parties involved, or asking thought-provoking questions. If a peer comments on your posting, please reply. To post a reply, click “Reply” on a particular discussion, write your feedback and then click on “Post to forum.”
-
Students mustViewReceive a gradeReceive a passing grade
To access the quiz, click on the name of the quiz provided above. On the following screen, click the attempt quiz button to respond to the questions.
-
Quiz: Module 7
To access the quiz, click on the name of the quiz provided above. On the following screen, click the attempt quiz button to respond to the questions.
TO PASS THIS QUIZ YOU MUST OBTAIN A SCORE OF 80%.
Not available unless: The activity Quiz: Module 6 is marked complete
- Describe the Chi-Square distribution.
-
 Competency covered in this module:
 - MCAT: Use data to explain relationships between variables or make predictions.
-
Student Learning Outcomes:
Upon completion of this lesson, you will be able to:- Explain the concept of correlation and how it differs from causation.
-
Identify positive and negative associations from a scatter plot.
- Calculate r, the correlation coefficient of the two variables.
- Utilize the rule of thumb for the interpretation of the calculated correlation coefficient.
- Differentiate between the coefficient of correlation and the coefficient of determination.
- Test the Correlation Coefficient for Significance.
-
Required Learning Resources and Activities
-
Students mustView
Read entire page. (3 minutes)
Social and Public Health Unit, University of Glasgow - 2022
-
Students mustView
Read Entire section - Scatterplots and Correlation. (18 minutes)
University of West Georgia - 2021
-
Students mustView
Read up to the end of Linear Correlation Coefficient (before Simple Linear Regression). (25 minutes)
Milne Library, SUNY at Genesco - 2022
-
Students mustView
Read entire page. (3 minutes)
University of Wisconsin, Green Bay - 2022
-
Students mustView
Read entire page. (27 minutes)
LibeTexts, UC Davis - 2022
-
Students mustViewStart discussions: 1
In this activity, you will discuss the concepts of correlation and causation.
Step 1. Review
Review the learning resources for this lesson before answering the question.
Step 2. Analyze
Analyze and discuss the question below.
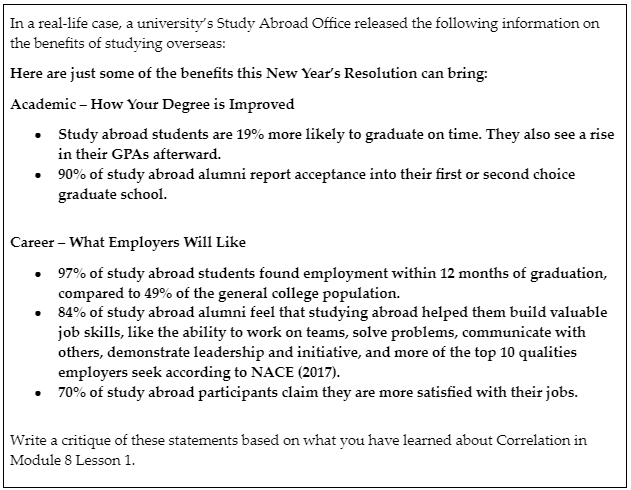
Step 3. Respond
Respond to the case problem by writing a 300-500-word discussion post with the following inclusions.
Step 4. Share
To share your work, click on the “Add a new discussion topic” button under this post and paste your work in the “Message” box. Make sure to reference others’ intellectual property when necessary. All references should follow 7th Edition APA formatting. For further instructions, see the resource on the Himmelfarb Health Sciences Library: APA citation resource (N.B. references are excluded from word counts).
Step 5: Interact
To complete the activity, you will need to reply to at least two posts made by your peers in a respectful and professional manner. Ensure that your post engages your peers' ideas by including a reflection on their comments, sharing ideas of other potential difficulties and parties involved, or asking thought-provoking questions. If a peer comments on your posting, please reply. To post a reply, click “Reply” on a particular discussion, write your feedback and then click on “Post to the forum.”
OPTIONAL Step 6: Interact (10 minutes)
If you would like to, you can reply to your peers' posts in a respectful and professional manner. Ensure that your post engages your peers' ideas by including a reflection on their comments, sharing ideas of other potential difficulties and parties involved, or asking thought-provoking questions. If a peer comments on your posting, please reply. To post a reply, click “Reply” on a particular discussion, write your feedback and then click on “Post to forum.”
- Explain the concept of correlation and how it differs from causation.
-
Student Learning Outcomes:
Upon completion of this lesson, you will be able to:- Explain the concept of Linear Regression.
-
Find the Linear Regression equation and use it to Predict.
- Test the Outliers, Influential Observations, and Leverage Points.
-
Required Learning Resources and Activities
-
Students mustView
Read entire page. (8 minutes)
Rice University - 2021
-
Students mustView
Watch the entire video. (5 minutes)
Rice University - 2021
-
Students mustView
Read entire page. (5 minutes)
Penn State, Elberly College - 2020
-
Students mustView
Read entire page. (35 minutes)
Penn State University, Eberly College of Science
-
Quiz: Module 8
To access the quiz, click on the name of the quiz provided above. On the following screen, click the attempt quiz button to respond to the questions.
TO PASS THIS QUIZ YOU MUST OBTAIN A SCORE OF 80%.
Not available unless: The activity Quiz: Module 7 is marked complete
- Explain the concept of Linear Regression.
-
-
Final Exam Quiz
To take the final exam, you must complete all quizzes and complete all the required activities. The final exam consists of 37 questions, and you will have 95 minutes to complete it. When the time is over, you will have two minutes to submit your attempt before it expires, and your progress is discarded. You will not be able to answer additional questions in the grace period.
To access the exam, click on the name of the exam provided above. On the following screen, click the attempt quiz button to respond to the questions.
Not available unless: All of: ...Not available unless:-
All of:
- The activity Course Registration is marked complete
- The activity Pre-Test is marked complete
- The activity Quiz: Module1: Lessons 1 & 2 is marked complete
- The activity Quiz: Module1: Lessons 3 & 4 is marked complete
- The activity Quiz: Module 1 is marked complete
- The activity Quiz: Module 2 is marked complete
- The activity Quiz: Module 3: Lessons 1, 2 & 3 is marked complete
- The activity Quiz: Module 3: Lessons 4 & 5 is marked complete
- The activity Quiz: Module 3 is marked complete
- The activity Quiz: Module 4: Lessons 1, 2 & 3 is marked complete
- The activity Quiz: Module 4: Lessons 4 & 5 is marked complete
- The activity Quiz: Module 4 is marked complete
- The activity Quiz: Module 5 is marked complete
- The activity Quiz: Module 6 is marked complete
- The activity Quiz: Module 7: Lessons 1 & 2 is marked complete
- The activity Quiz: Module 7: Lessons 3 & 4 is marked complete
- The activity Quiz: Module 7 is marked complete
- The activity Quiz: Module 8 is marked complete
-
All of:
- The activity Discussion Forum 1 is marked complete
- The activity Practical Activity 1 is marked complete
- The activity Discussion Forum 2 is marked complete
- The activity Practical Activity 2 is marked complete
- The activity Discussion Forum 3 is marked complete
- The activity Practical Activity 3 is marked complete
- The activity Discussion Forum 4 is marked complete
- The activity Practical Activity 4 is marked complete
- The activity Practical Activity 5 is marked complete
- The activity Practical Activity 6 is marked complete
- The activity Discussion Forum 5 is marked complete
-
All of:
-
-
 In this section, you can provide feedback about this course to help us make NextGenU.org better. Once evaluations are completed, you will be able to download your certificate of completion.
-
Course Evaluation QuestionnaireNot available unless: The activity Final Exam is marked complete
-
Self Evaluation QuestionnaireNot available unless: The activity Final Exam is marked complete
-
-
-
Students mustMark as done
-
Students mustMark as done
-
-