

Section: Module 5: Lesson 1: Simple Linear Regression Analysis | Biostatistics | NextGenU.org
-
Learning Objectives
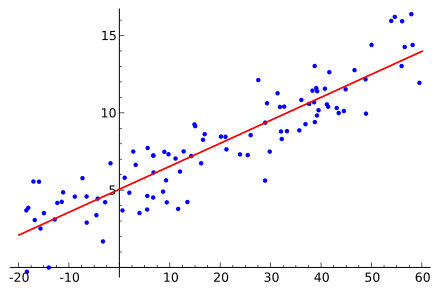
- Understand linear relationships, outliers, and the basics of correlation.
- Understand the difference between correlation and simple linear regression, and when to apply one or the other.
- Understand homoscedasticity and its applications to correlation and regression.
- Understand linear regression and how it relates to prediction.
-
Students mustView
- Download the PDF version of the text by clicking on the appropriate link. Then, in Chapter 12 titled "Linear Regression and Correlation", read the introductory section along with sections 12.1, 12.2, 12.3, and 12.6 (pages 679-691 and 697-704).
- Understand linear relationships, outliers, and the basics of correlation
-
- Read down to the beginning of the section titled "How the test works".
- Understand the difference between correlation and simple linear regression, and when to apply one or the other
-
Students mustView
- Read the web page as well as sections 1.2 and 1.3. Access sections 1.2 (What is the "Best Fitting Line"?) and 1.3 (The Simple Linear Regression Model) by clicking on the titled links found on the left side of the web page.
- Understand the difference between correlation and simple linear regression, and when to apply one or the other
-
-
Students mustView
- Read the web page as well as sections 2.1 to 2.5. Access sections 2.1 (Inference for the Population Intercept and Slope), 2.2 (Another Example of Slope Inference), 2.3 (Sums of Squares), 2.4 (Sums of Squares (continued)), and 2.5 (Analysis of Variance: The Basic Idea) by clicking on the titled links found on the left side of the web page.
- Understand the difference between correlation and simple linear regression, and when to apply one or the other
-
Students mustView
- Scroll down and read the section titled "Assumptions" to understand the definition of Homoscedasticity.
- Understand homoscedasticity, and its applications to correlation and regression
-
Students mustView
- Read the web page as well as sections 3.1 to 3.3. Access sections 3.1 (The Research Questions), 3.2 (Confidence Interval for the Mean Response), and 3.3 (Prediction Interval for a New Response) by clicking on the titled links found on the left side of the web page.
- Understand linear regression and how it relates to prediction
-
Students mustView
- Read the web page as well as sections 4.1 to 4.8. Access sections 4.1 (Background), 4.2 (Residuals vs. Fits Plot), 4.3 (Residuals vs. Predictor Plot), 4.4 (Identifying Specific Problems Using Residual Plots), 4.5 (Residuals vs. Order Plot), 4.6 (Normal Probability Plot of Residuals), 4.7 (Assessing Linearity by Visual Inspection), and 4.8 (Further Examples) by clicking on the titled links found on the left side of the web page.
- Understand linear regression and how it relates to prediction
-
Students mustViewReceive a grade
To access the quiz, click on the name of the quiz provided above. On the following screen, click the "Preview quiz now" button to view the case studies and respond to the questions.
-
Students mustView
- Read the entire article.
-
- Download the PDF version of the text by clicking on the appropriate link. Then, read sections 12.4 and 12.5 titled "Testing the Significance of the Correlation Coefficient" and "Prediction" respectively (pages 691-697).