

Section: Module 5: Lesson 4: Overview of Correlation and Regression Analysis | Biostatistics | NextGenU.org
-
Learning Objectives
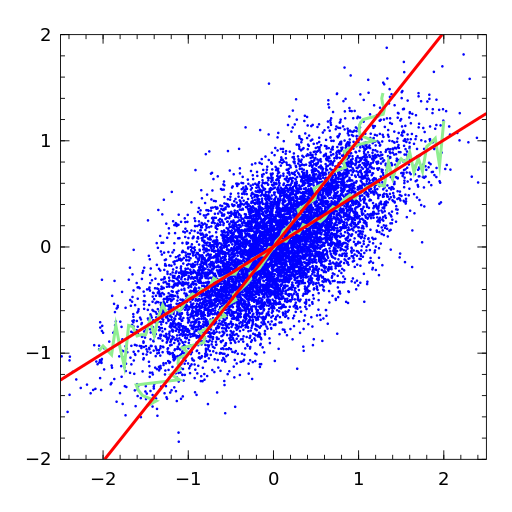
- Be able (1) to distinguish between correlation, linear and multiple regression, and logistic regression, and (2) to understand the purpose and methods of linear (simple and multiple) and logistic regression, including when to use each of them.
- Be able to specify regression models and interpret regression results.
-
- Read the entire article.
- Be able (1) to distinguish between correlation, linear and multiple regression, as well as logistic regression, and (2) to understand the purpose and methods of linear (simple and multiple) and logistic regression including when to use each of them
-
Students mustViewReceive a grade
- The fitted equation from a study on infant head circumference is as follows:
head circumference = 1.76 + 0.86×gestational age - 2.82×toxemia
+ 0.046×(gestational age×toxemia)
where gestational age is measured in weeks and toxemia is an indicator variable for the mother’s toxemia status during pregnancy (1=had toxemia).
- For infants whose mothers did not have toxemia during pregnancy, what is the effect of an extra two weeks of gestation? What about for those whose mothers had toxemia?
- What other information or calculations would you need to decide whether to include this effect in the final model?
- What effect does the last term represent? How would you interpret this effect?
- Be able to specify regression models and interpret regression results
-
Students mustViewReceive a grade
- Consider the following hypothetical scenario: Two experimental treatments (A and B) are administered to patients having just suffered a stroke. After a few months, the following data is obtained (Table 1). A multivariate logistic regression model is later constructed from this data (Table 2). Answer questions 1-9 based on this information.
Table 1: Effect of treatment on stroke survival by smoking statusPatients
Treatment A
Treatment B
Total
Non-smokers
No. of deaths
46
8
54
No. of survivors
105
37
142
Total
151
45
196
Smokers
No. of deaths
105
15
120
No. of survivors
160
81
241
Total
265
96
361
Table 2: Results from a multivariate logistic regression based on data from Table 1 (Reference group = non-smokers, treatment B)Parameter
Fitted value of β
Intercept
(Ref. group: non-smoker, treatment B)β0 = -1.856
Smoking status
β1 = 0.314
Treatment option
β2 = 1.090
Questions- From Table 1, calculate the odds ratio of death for non-smokers under treatment A .
- From Table 1, calculate the odds ratio of death for smokers under treatment B.
- Explain in words what these odds ratios mean.
- From Table 2, write the corresponding multivariate logistic regression equation. Indicate what the variables mean and which values they can take.
- Calculate the odds of death and the probability of death for non-smokers under treatment B.
- Calculate the odds of death and the probability of death for smokers under treatment B.
- Calculate the odds of death and the probability of death for non-smokers under treatment A.
- Calculate the odds of death and the probability of death for smokers under treatment A.
- What is the sum of all the probabilities?
- Be able to specify regression models and interpret regression results
-
Students mustViewReceive a grade
To access the quiz, click on the name of the quiz provided above. On the following screen, click the "Preview quiz now" button to view the case studies and respond to the questions.
-
- Read the entire article.
-
Answer key. Linear regression problem 1 File17.9 KB
-
Answer key. Linear regression problem 2 File28.9 KB