Section: Module 2: Lesson 1: Interpreting Psychological Phenomena | Introduction to Mental Health Professions | NextGenU.org
-
Student Learning Outcomes:
Upon completion of this lesson, you will be able to:
- Identify the difference between phenomena and theories.
- Describe the three dimensions of psychological theories.
- Discuss how theories are tested and evaluated in psychology.
- Recognize how hypotheses are developed.
- Describe how a research study is designed.
- Discuss effective ways for data analysis.
- Describe the method of drawing conclusions and preparing reports.
- Identify and navigate psychology databases and other legitimate sources of psychology information.
- Describe what kinds of additional information beyond personal experience is acceptable in developing behavioral explanations.
- Interpret simple graphs and statistical findings.
-
Students mustMark as done
Required Learning Resources and Activities
-
-
Students mustView
Read the entire webpage. (13 minutes)
-
Students mustView
Read from "Learning Objectives" to "Key Takeaways." (22 minutes)
-
Students mustView
Read from "Learning Objectives" to "Key Takeaways." (15 minutes)
-
-
-
Students mustView
Read the entire webpage. (6 minutes)
-
Students mustView
Read from "Learning Objectives" to "Key Takeaways." (21 minutes)
-
-
Students mustView
Read the entire webpage. (11 minutes)
-
Students mustView
Read the entire webpage. (10 minutes)
-
-
Students mustView
Read the entire webpage. (8 minutes)
-
-
-
-
-
Students mustView
In this learning activity, you will select any one of the psychology articles mentioned below. You will identify the study’s hypothesis, research methods, and conclusions drawn and will discuss why the selected research method was appropriate.
- The Effects of Instagram Use, Social Comparison, and Self-Esteem on Social Anxiety: A Survey Study in Singapore.
- Self-esteem, Social comparison, and Facebook Use.
You can use this as a guideline to help you navigate through the research articles.
Instructions:
Step 1: Select
Select one of the two journal articles identified.
Step 2: Identify
Identify the study’s hypothesis, research methods and conclusions drawn.
Step 3: Respond
Write a 250-500 piece of writing explaining why you believe that the chosen methodology was appropriate for the study based on the results presented and conclusions drawn. Ensure that you include the following information in your answer:
- What is the researcher’s main hypothesis?
- What methodology/research design did the researcher undertake?
- What conclusions can be drawn from the research findings?
- Do you agree/disagree with the methodology selected?
- What are the main advantages and disadvantages of using the selected research method?
Step 4: Share
To share your work, click on the “Reply” button under this post and paste your work in the “Message” box. Make sure to reference others’ intellectual property when necessary. All references should follow 7th Edition APA formatting. For further instructions, see the resource on the Himmelfarb Health Sciences Library: APA citation resource (N.B. references are excluded from word counts).
Step 5: Interact
To complete the activity, you will need to reply to at least two posts made by your peers in a respectful and professional manner. Be sure that your post engages your peers' ideas by including a reflection on their comments, sharing ideas on other potential difficulties and parties involved, or asking thought-provoking questions. If a peer comments on your posting, please reply. To post a reply, click “Reply” on a particular discussion, write your feedback and then click on “Post to forum.” You can use the following as a guide:
- Did you observe anything different in terms of the study’s hypothesis, research methods or conclusions drawn?
- Do you agree or disagree with the rationale provided for the selected research method?
OPTIONAL Step 6: Interact (10 minutes)
If you would like to, you can reply to your peers' posts in a respectful and professional manner. Ensure that your post engages your peers' ideas by including a reflection on their comments, sharing ideas of other potential difficulties and parties involved, or asking thought-provoking questions. If a peer comments on your posting, please reply. To post a reply, click “Reply” on a particular discussion, write your feedback and then click on “Post to forum.”
-
Students mustViewStart discussions: 1
In this activity you will review a case study and interpret the statistical findings.
Step 1: Review
Data
The following dataset is based on the famous study “Internet Paradox. A social technology that reduces social involvement and psychological well-being?” Kraut R, Patterson M, Lundmark V, Kiesler S, Mukopadhyay T, and Scherlis W. Am Psychol. 1998 Sep; 53(9): 101731.
STUDY:
The September 1998 issue of the American Psychologist published an article by Kraut et al. that reported on an experiment examining “the social and psychological impact of the internet of 169 people in 73 households during their first few years online.” In the experiment, 73 households were offered free internet access for 1 or 2 years in return for allowing their time and activity online to be tracked. The members of the households who participated in the study were also given a battery of tests at the beginning and again at the end of the study. The conclusion of the study made news headlines: Those who spent more time online tended to be more depressed at the end of the experiment.
The news reports about this study clearly concluded that using the internet causes depression. Is such a conclusion warranted?
DATASET
The original dataset consisted of 169 observations (cases) that were measured across 8 variables: Internet Use, Depression Before, Depression After, Gender, Race, Age Group, Household Income, and Household Size.
The given dataset is 12 observations based on the original.
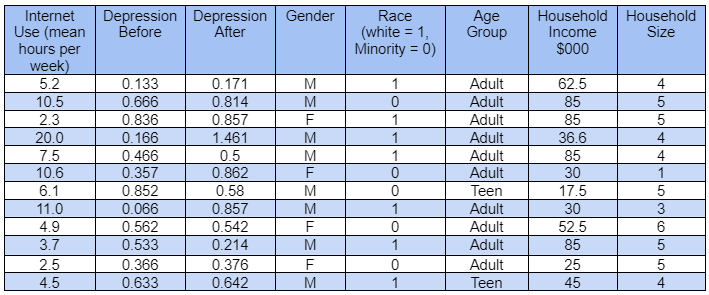
Questions
Graphing (Visualization)
- What type of graph should be used to represent the data of Variable 1 (Internet Use), a bar graph, a scatter plot, or a stem-and-leaf plot?
- What type of graph should be used to represent the data of Variable 8 (Household Size), a histogram or a scatter plot?
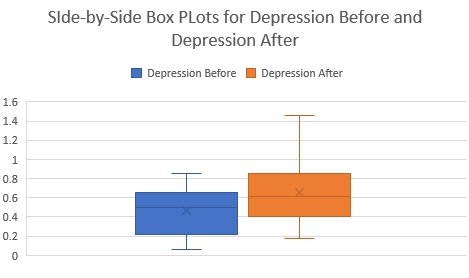
- Presented below is a graph with side-by-side boxplots for the Depression Before, and Depression After variables.
a. How do the ranges of the two variables differ?
b. Are there any potential outliers?
c. Compare the skewness of the graphs in terms of their being either Positively or Negatively skewed, or roughly symmetrical.
d. Compare the boxplots in terms of their variability as shown in the plots.
e. Compare the Interquartile Ranges of the two plots.
f. Which variable has the higher median depression level?Correlational Analysis
Now we will consider the scatterplot of the variables Internet Use (x-axis) and Depression After (y-axis). This graph is shown below.
- From the scatterplot shown above, what type of correlation does it suggest: positive, negative, little, or none?
- Calculate a Pearson’s r to determine analytically the type and strength of the relationship between Internet use and Depression After.
- How much of the variability in Depression After is accounted for by the number of hours of internet use per week?
- Calculate Cohen’s d for the variables Internet Use and Depression After, and give a brief explanation of what this statistic tells us.
Step 2: Interpret
Analyze and prepare a discussion piece of 250-300 words that respond all the points stated below.
Step 3: Share
To share your work, click on the “Add a new discussion topic” button under this post and paste your work in the “Message” box. Make sure to reference others’ intellectual property when necessary. All references should follow 7th Edition APA formatting. For further instructions, see the resource on the Himmelfarb Health Sciences Library: APA citation resource (N.B. references are excluded from word counts).
Step 4: Interact
To complete the activity, you will need to reply to at least two posts made by your peers in a respectful and professional manner. Be sure that your post engages your peers' ideas by including a reflection on their comments, sharing ideas on other potential difficulties and parties involved, or asking thought-provoking questions. If a peer comments on your posting, please reply. To post a reply, click “Reply” on a particular discussion, write your feedback and then click on “Post to forum.”
OPTIONAL Step 5: Interact (10 minutes)
If you would like to, you can reply to your peers' posts in a respectful and professional manner. Ensure that your post engages your peers' ideas by including a reflection on their comments, sharing ideas of other potential difficulties and parties involved, or asking thought-provoking questions. If a peer comments on your posting, please reply. To post a reply, click “Reply” on a particular discussion, write your feedback and then click on “Post to forum.”