

Section: Module 7: Lesson 4: Testing with Categorical Variables | Intro to Statistics | NextGenU.org
-
Student Learning Outcomes:
Upon completion of this lesson, you will be able to:- Describe the Chi-Square distribution.
-
Perform and interpret a Chi-Square test for Independence.
- Perform and interpret a Chi-Square Goodness-of-Fit test.
-
Students mustView
Read entire page: The Chi-Square Distribution. (5 minutes)
Rice University - 2021
-
Students mustView
Watch the video: Chi-Square Distribution. (3 minutes)
Rice University - 2021
-
Students mustView
Read entire page: Section - 11.3: Chi Square Test for Independence. (6 minutes)
Eberly College of Science, Penn State University - 2022
-
Students mustView
Read entire page: Worked example. (8 minutes)
Eberly College of Science, Penn State University - 2022
-
Students mustView
Watch the entire lecture video. (27 minutes)
-
Students mustView
Read entire page: Section - 11.2: Chi Square Goodness-of-Fit Test. (7 minutes)
Eberly College of Science, Penn State University - 2022
-
Students mustView
Read entire page - Section 11.2.1 -Five-Step Procedure. (7 minutes)
Eberly College of Science, Penn State University - 2022
-
Students mustView
Watch video. (7 minutes)
Eberly College of Science, Penn State University - 2022
-
Students mustView
Read entire page. (9 minutes)
Eberly College of Science, Penn State University - 2022
-
Students mustViewStart discussions: 1
Student Learning Outcome (Module 7 Lesson 4): Perform and interpret a Chi-Square Test for Independence.
Step 1. Review
Review the learning resources for this lesson before studying the case problem.
Step 2. Analyze
Analyze the case problem below.
The following table is based on data from 21,870 physicians aged 40 – 84 who are participating in the Physicians Health Study (“Light-to-Moderate Alcohol Consumption and Risk of Stroke Among US Physicians,” New England Journal of Medicine [2019]: 1557 - 1564):
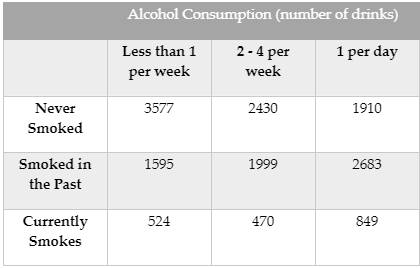
Calculate row proportions by dividing each observed count by the corresponding row total. Are the proportions falling in each of the alcohol consumption categories similar for the three smoking categories?
Test the hypothesis using 𝛼 = 0.05 that Smoking Status and Alcohol Consumption are independent.
Is your test result in Part 2 consistent with what you expected based on your answer to Part 1? If not, explain why your initial impression based on the proportions may not have been accurate.
Step 3. Respond
Respond to the case problem by writing answers to Parts 1, 2, and 3.
Step 4. Share
To share your work, access to the first post below and click on the “Reply” button under this post and paste your work into the “Message” box. Make sure to reference others’ intellectual property when necessary. All references should follow 7th Edition APA formatting. For further instructions, see the resource on the Himmelfarb Health Sciences Library: APA citation resource (N.B. references are excluded from word counts).
Step 5: Interact
To complete the activity, you will need to reply to at least two posts by your peers respectfully and professionally. Ensure that your post engages your peers' ideas by including a reflection on their comments, sharing ideas of other potential difficulties and parties involved, or asking thought-provoking questions. If a peer comments on your posting, please reply. To post a reply, click “Reply” on a particular discussion, write your feedback and then click on “post to the forum.”
OPTIONAL Step 6: Interact (10 minutes)
If you would like to, you can reply to your peers' posts in a respectful and professional manner. Ensure that your post engages your peers' ideas by including a reflection on their comments, sharing ideas of other potential difficulties and parties involved, or asking thought-provoking questions. If a peer comments on your posting, please reply. To post a reply, click “Reply” on a particular discussion, write your feedback and then click on “Post to forum.”
-
Students mustViewReceive a gradeReceive a passing grade
To access the quiz, click on the name of the quiz provided above. On the following screen, click the attempt quiz button to respond to the questions.
-
Quiz: Module 7
To access the quiz, click on the name of the quiz provided above. On the following screen, click the attempt quiz button to respond to the questions.
TO PASS THIS QUIZ YOU MUST OBTAIN A SCORE OF 80%.
- Describe the Chi-Square distribution.