

Activity 1, Module 3
Opened: Thursday, April 25, 2024, 12:00 AM
Activity 1, Module 3: Basic Charts (30 minutes)
Part 1
1. Open Excel.
2. Enter the data into your spreadsheet, as shown in the figure below.
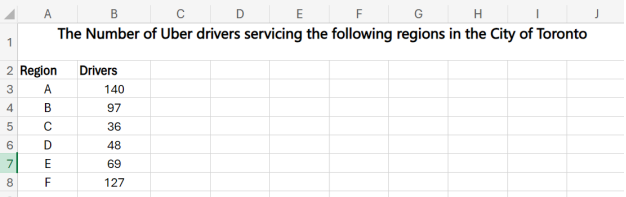
3. Use the given data to create a pie chart.
4. Make the chart a large size for ease of use.
5. Give the chart the title “The Number of Uber Drivers ServicingRegions A – F for
March 2024.”
6. Move the legend to the right of the plot area.
7. Change the values to percentages and move the pie labels to the outside of the
pie slices.
Completion requirements:
- View
- Make a submission